The stock market has been hovering near all-time highs for months but hasn’t been able to breakout. If the stock market doesn’t get going soon, it could head lower. And should that happen, investors will be looking for somewhere to put there month. For several years, investors have moved quickly to bonds. But perhaps this time could see a capital move to the Gold Miners ETF (GDX).
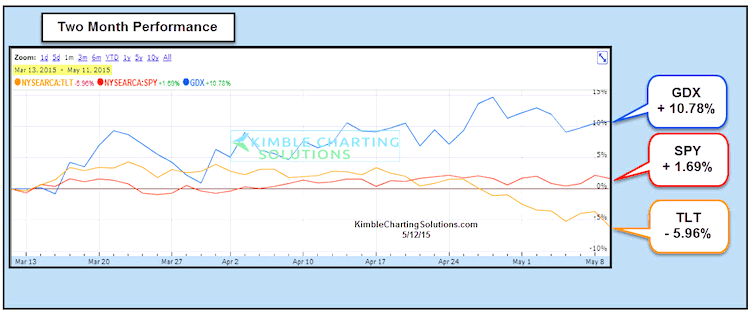
As you can see in the chart below, the 20+ Year Treasury Bond ETF (TLT) hasn’t been acting well at all.
S&P 500 (SPY) vs TLT vs GDX Performance Chart
The precious metals have been hit hard over the past several years, but the Gold Miners ETF is acting a little better than both the S&P 500 and TLT over the past two months.
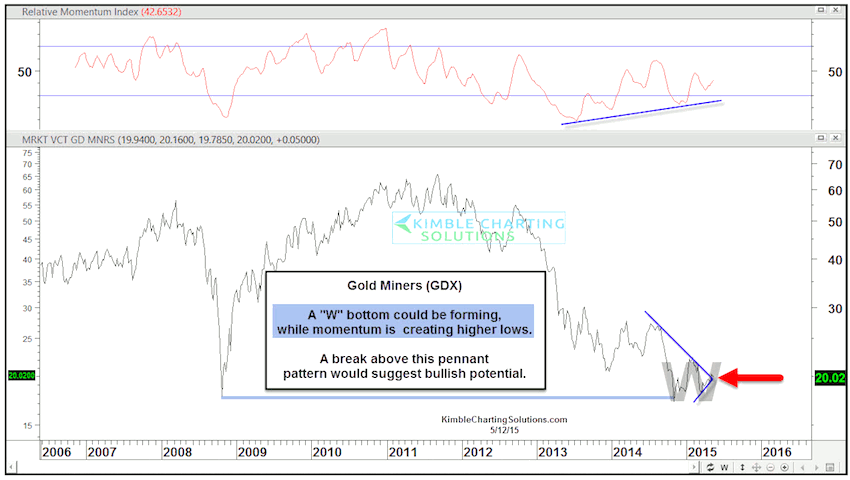
The next chart looks at GDX over the past nine years. As you can see, the Gold Miners decline over the past few years has taken it back to the lows set during the financial crisis in 2008. But it is currently creating higher lows and may be forming a W bottom pattern. This could be indicative of interest in the Gold Miners ETF in the wake of a muddling stock and bond market.
Gold Miners ETF (GDX) Chart
This is merely an observation and does not imply that the bear market is over with! Before anyone gets too bullish, GDX need to prove itself by breaking out of its near term pennant formation… and then following through higher. Active investors will need some patience and discipline (and perhaps a shorter time frame). Thanks for reading.
Follow Chris on Twitter: @KimbleCharting
Author does not have a position in any mentioned securities at the time of publication. Any opinions expressed herein are solely those of the author, and do not in any way represent the views or opinions of any other person or entity.


