Gold began 2019 with a head of steam.
Gold investors had hopes of tailwinds coming from a soft US Dollar and potential rising rates environment (i.e. inflation).
Then the Federal Reserve suddenly switched gears and became less hawkish, causing rates to fall. And the US Dollar firmed up and confirmed its intermediate term rally.
Meanwhile, Gold prices topped out in late February and have been in a 3 month sideways-to-lower decline since. Consolidation? Continued long-term range? Or something worse? The Federal Reserve statement on Wednesday should give us clues and may be a catalyst for gold (and the broader market). We will have to watch Gold’s reaction over the next week to see how it shakes out.
Note that the following MarketSmith charts are built with Investors Business Daily’s product suite.
I am an Investors Business Daily (IBD) partner and promote the use of their products. The entire platform offers a good mix of technical and fundamental data and education.
Gold Chart
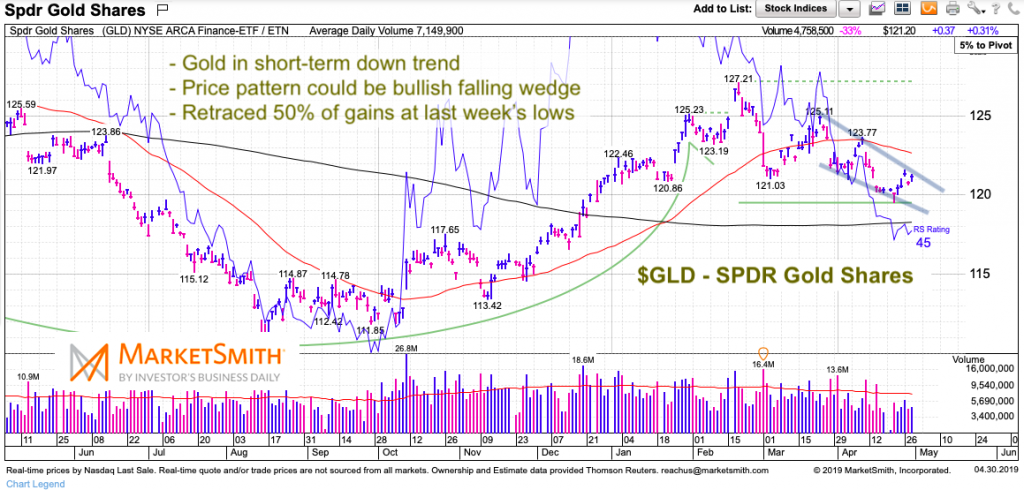
Gold prices are in a near-term downtrend. There’s a “very short-term” trading wedge that, if broken to the upside, would be constructive (see chart). There’s also a slightly wider lens short-term wedge that has $118 as support and $123 as resistance.
Last week’s lows formed at the 50 percent fibonacci retracement of the 5 month rally. The 61.8 Fib retrace comes in just below $118.
The 50 day moving average for the Gold ETF has turned back down, while the 200 day has flattened out. Whether it’s the moving averages / wedge compression, or it’s the Federal Reserve, it will soon be “go” time. $118 and $123 are on my radar. Remain patient, and remember to buckle up.

Twitter: @andrewnyquist
The author has a position in mentioned securities at the time of publication. Any opinions expressed herein are solely those of the author, and do not in any way represent the views or opinions of any other person or entity.


