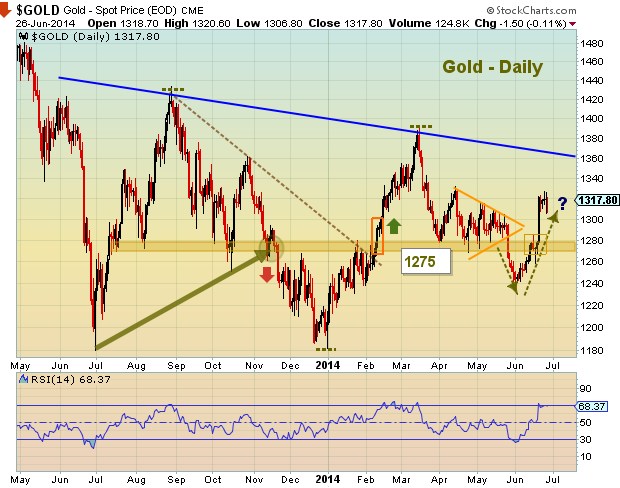
 Just as Gold looked destined to retest the lows, the yellow metal found its shine and rallied into the Fed statement on June 18, 2014. In the trading business, we call that a “head fake.” And it came at the perfect time – right as Gold investors were about to give up. 80 points later, Gold has emerged from its slumber and may be ready to rally.
But in a terrain that has recently been littered with Fool’s Gold, active investors need to be disciplined and aware.
Here are 5 things For Gold investors to watch that may impact the yellow metal’s performance this summer:
1) Reversals – Is this the one that sticks? The break below $1275 (a key price toggle) seemed to seal the bulls fate… but Gold prices pivoted around $1240 and reversed higher back through $1275: A nice pendulum reversal. As long as $1275 remains supportive, Gold appears likely to move higher this summer.
2) Seasonality – As referenced in Stock Trader’s Almanac, Gold is seasonally weak into June and often finds a tradable bottom during this time (take last year as example). Pair this with very poor sentiment, and the yellow metal may have found a bottom… remember, sentiment works both ways, and a solid dose of skepticism can help to fuel a rally.
3) Wide Range – Active investors need to be aware that Gold has traded in a wide range since last summer’s bottom: $1180 – $1440. Even so, $1440 is still 9 percent higher.
Gold Spot Prices – Daily bar chart (since last summer’s bottom)
4) Potential Bullish Technical Pattern(s) – Yes, that’s plural. For one, although wide-ranging, Gold investors have to like the base building over the past year. This often leads to solid rallies. And on top of that, Gold prices have formed a bit of an unorthodox Head & Shoulders technical pattern that could lead to much higher prices, perhaps allowing for a retest of $1500. But even if you dismiss the pattern, Gold has clearly defined downtrend resistance ($1360ish) that, if broken to the upside, would allow for a nice rally.
5) Catalysts – Gold is greatly affected by geopolitics, government-related turmoil, and financial instability. Although speculating on when/where these type of events will occur is difficult (and risky), it’s always good for Gold investors to be aware of current global news events… especially if Gold holds above $1275. Price action is dictated by human behavior, so elevated Gold prices may be a sign of underlying tensions (or near-term catalysts).
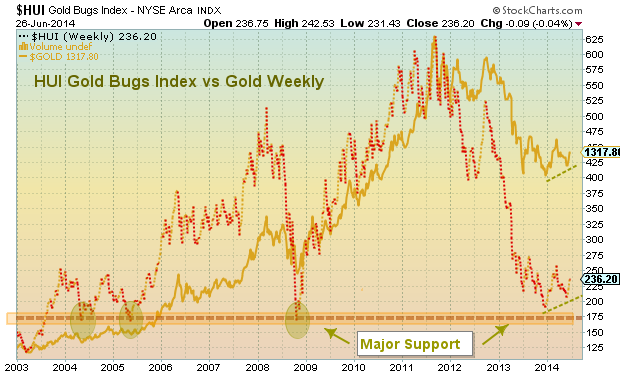
With this in mind, keep an eye on the Gold Bugs Index (HUI). Like Gold, it has formed a higher low (constructive), but is still awaiting confirmation via a higher high. Higher highs on both would indicate that the rally has some staying power. And that new (or renewed) turmoil/tensions may be emerging.
Parting comments: Keep an eye on $1275. I have found a way to write about Gold $1275 several times over the past year. It is an important Fibonacci retracement level and lateral price toggle. The pendulum reversal and recapture of $1275 was a pivotal moment for Gold investors… perhaps solidifying a summer gold bottom.
Thanks for reading. Trade safe.
No position in any of the mentioned securities at the time of publication. Any opinions expressed herein are solely those of the author, and do not in any way represent the views or opinions of any other person or entity.


