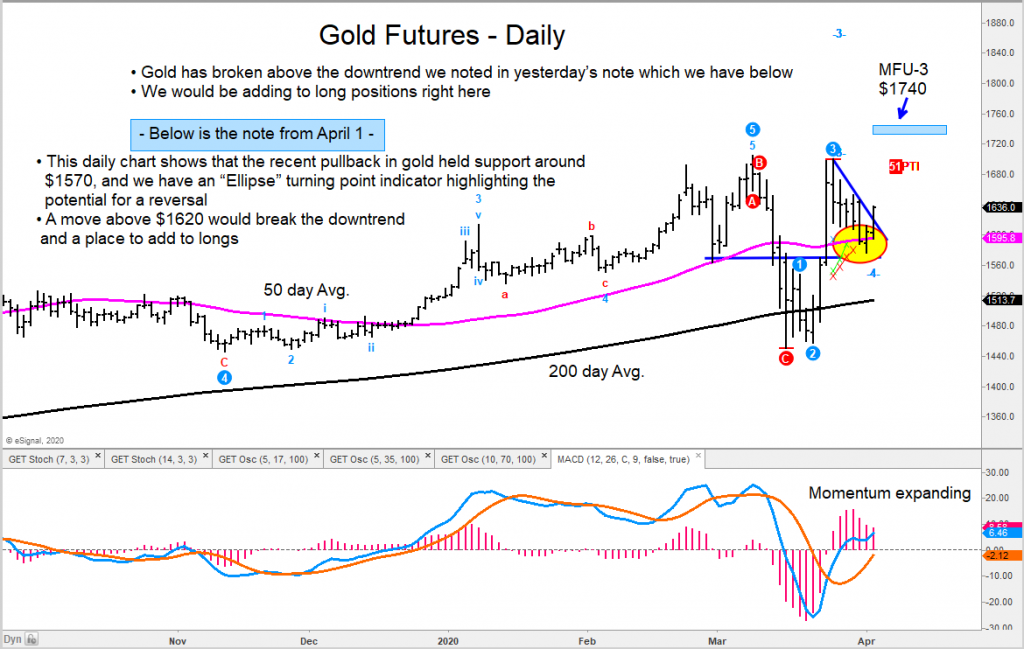
Gold Futures “daily” Trading Chart
After forming a tradable bottom in March, Gold futures rallied up to test its 2020 highs.
Since then, Gold has fallen in a flag-like consolidation, reaching what I think may have been another tradable bottom early this week.
Our ellipse turning point indicator highlighted this potential reversal. And today Gold is attempting to breakout over this multi-day downtrend line.
If Gold futures can sustain a move over $1620, the rally should continue. It could continue as high as $1740 over the short-term.
Traders should always use trailing stops, and particularly in this volatile market environment.
The author may have a position in mentioned securities at the time of publication. Any opinions expressed herein are solely those of the author, and do not in any way represent the views or opinions of any other person or entity.


