 The past two months have seen Gold prices trade in a range of $1130-$1230. And after slipping a bit this morning on a Greek vote that failed to elect a President, Gold futures are trading around $1193/oz. So where is gold and what’s price telling us from an intermediate and macro perspective.
Note that I provided two update posts on gold futures in November (11/3 here and 11/26 here), as well as another note in July 2014, making the case for lower Gold prices.
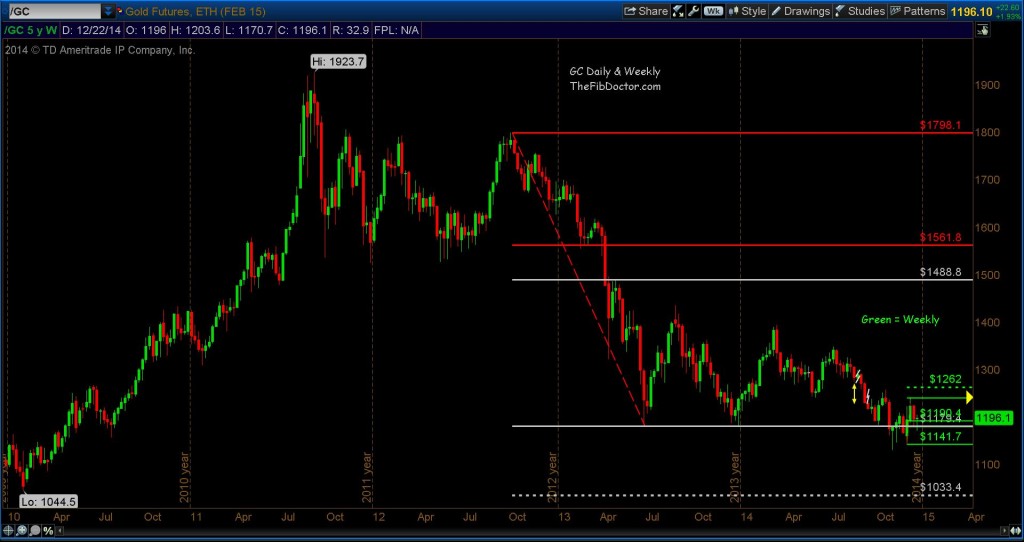
The gist of all three posts was to highlight daily and weekly targets, support and resistance levels, and show a longer term target of 1033.40 for Gold futures (which is still valid).
So let’s take a look and see how the price of Gold Futures is faring now as 2014 draws to a close.
Starting with a 5 year, weekly chart, you can see where I’ve drawn a “fib within a fib.” This is nothing more than shorter term Fibonacci levels drawn inside a larger one. In the chart below, you’ll see a weekly target of 1262 and the aforementioned longer term target of 1033.40.
Gold Futures 5 Year, Weekly chart
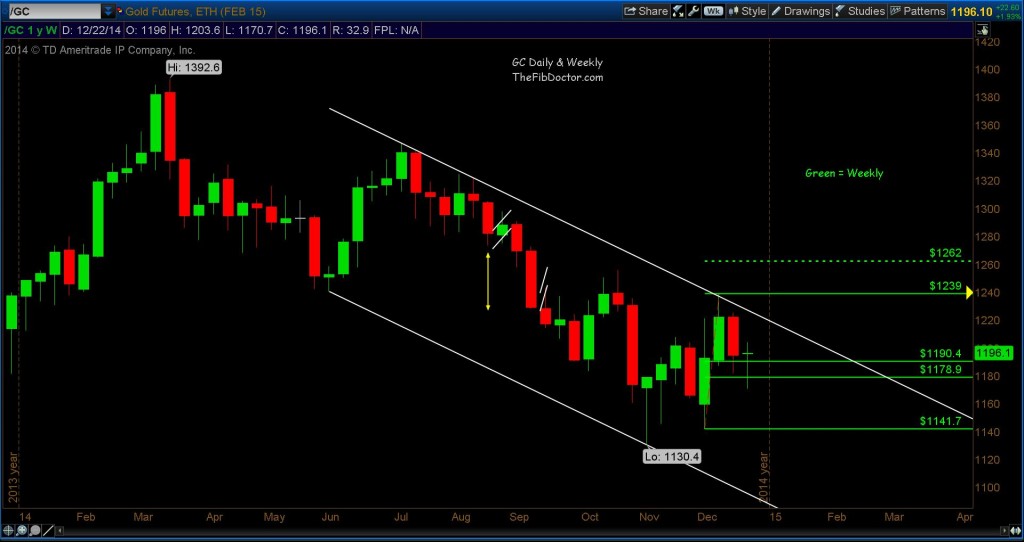
Now let’s drill down to a 1 year, weekly chart for Gold and find our support levels. In the chart below, you’ll see 2 weekly support levels; 1190.40 & 1178.90, both of which have been hit and held. Although price has been able to hold these levels, the last two weeks have shown some weakness. The weekly target is 1262. In the last 3 weeks, price has made a high of 1239, $23 shy of the target.
Gold Futures 1 Year, Weekly Chart
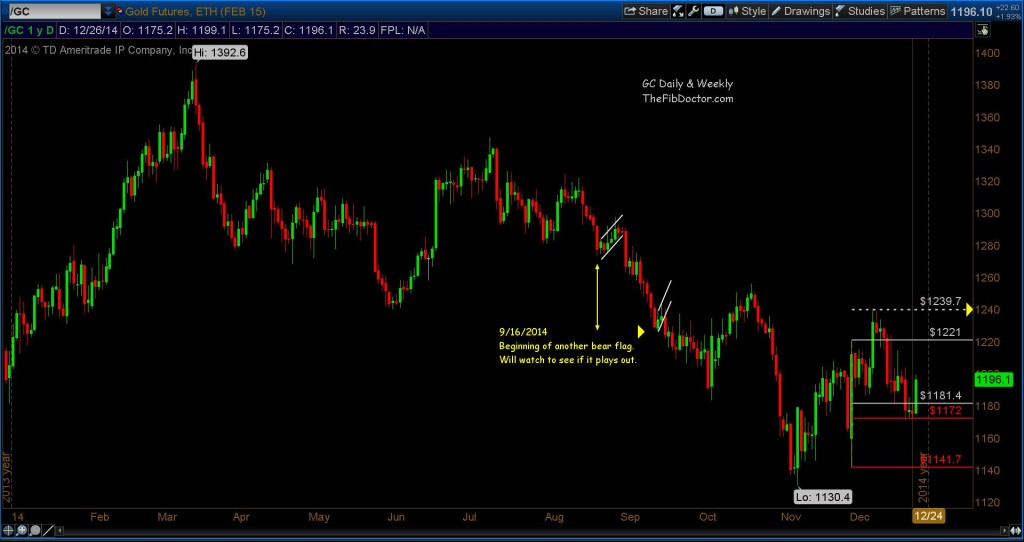
Now let’s go in for a tighter look at Gold using a daily chart. Looking at the complete year of 2014, you’ll see Gold Futures are basically back to where they began; actually price in this chart is currently $26.30 lower than the close on January 2nd, 2014.
The current short term daily target is 1239.70 with two support levels at 1181.40 and 1172. Both support levels have been hit and held but the target has not been hit.
At this time, I’m maintaining my longer-term target of 1033.4.
Gold Futures 1 year, Daily Chart
Thanks for reading!
Follow Dave on Twitter: @TheFibDoctor
No position in any of the mentioned securities at the time of publication. Any opinions expressed herein are solely those of the author, and do not in any way represent the views or opinions of any other person or entity.


