Bollinger Bands are an excellent technical indicator for traders to keep an eye on.
And right now, they are signaling a potential options trade on Gold… specifically, the Gold ETF (NYSEARCA:GLD).
First, more on Bollinger bands… I love using them in combination with the Bollinger Band width indicator which can be an awesome early indicator of whether a stock is likely to increase or decrease in volatility going forward.
Bollinger Bands are price channels with the upper band being 2 standard deviations above the middle line and the lower band being 2 standard deviations below from the middle line. The middle line is typically a 20 day moving average.
One of my favorite ways to use Bollinger Bands is to wait until they show extreme contraction and then play for a breakout.
I don’t care which way the breakout goes, as long as it breaks out.
Two charts that caught my eye this week are the SPDR Gold ETF (NYSEARCA: GLD) and Russell 2000 (INDEXRUSSELL: RUT). In this article, I’ll focus on the Gold(GLD). Look for one on the Russell 2000 tomorrow.
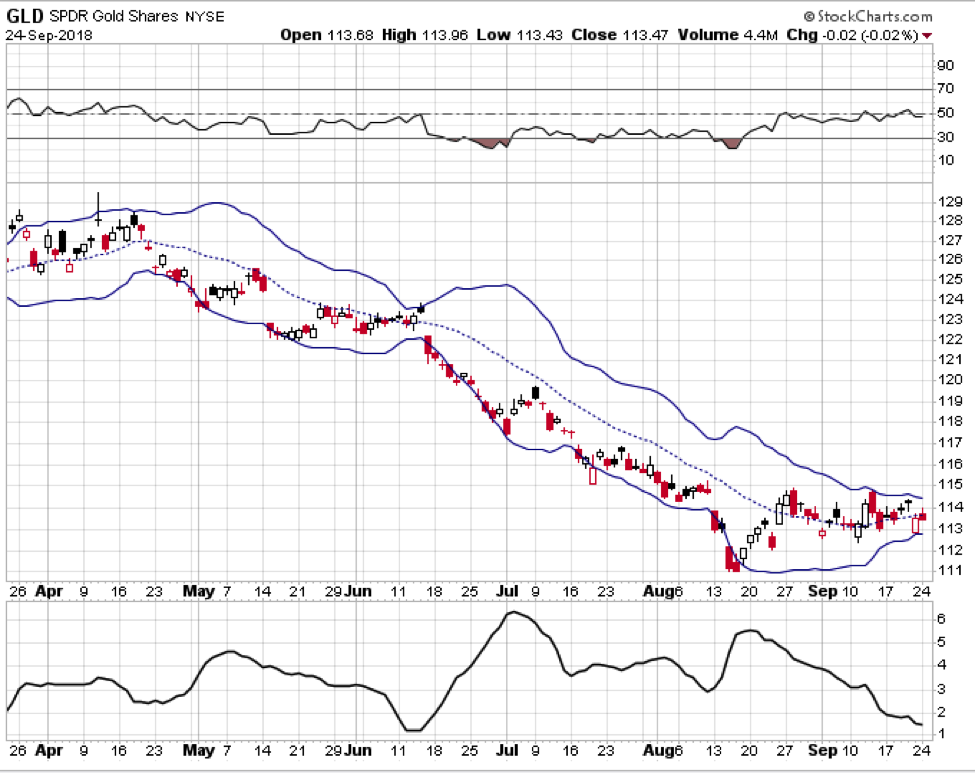
As you can see in the chart below, GLD has very tight Bollinger Bands in comparison to the last 6 months.
For a trade like this I would usually buy the 6-month straddle. I would also have a timed exit to close the trade after 1 month to minimize the impact of time decay.
Gold has low implied volatility compared to its recent past. Personally, I might wait another 2-3 days to see if we get some more sideways action before opening this trade.
Gold ETF (GLD) Chart with Bollinger Bands
Catch more of my options trading analysis over at my site Options Trading IQ. Thanks for reading.
Twitter: @OptiontradinIQ
The author does not have a position in mentioned securities at the time of publication. Any opinions expressed herein are solely those of the author, and do not in any way represent the views or opinions of any other person or entity.


