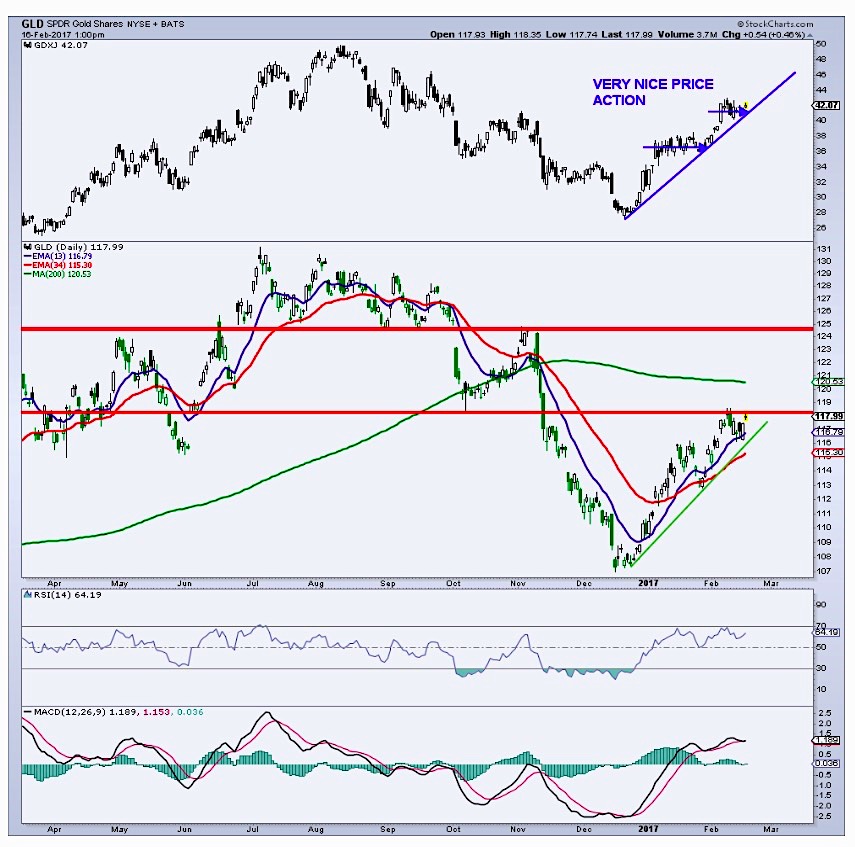
After a second wave higher in the 2017 rally, gold prices spent much of last week trading in consolidation mode.
Although the backdrop is bullish, the shiny metal nears key price resistance.
Gold Price Resistance
The SPDR Gold Shares (NYSEARCA:GLD) is sitting just under minor chart resistance near 118. And just above that lies the 200-day average in the 121 region.
Gold Price Support
On the downside, the recent low at 113 represents key support. I’ve also included a chart of the Junior Miners ETF (GDXJ). Note the smaller recent pullbacks in GDXJ as the stocks continue to act better than the metal (GLD). While GLD pulls back from time to time, GDXJ has basically traded sideways, pretty solid price action.
Commitment of Traders Data
The COT data recently reached bullish territory as commercial hedgers have decreased their net short position by over 200,000 contracts in recent months. At the same time, large speculators have sharply reduced their net long position. Despite the rally since December, sentiment is less than neutral so a bullish turn here could add fuel to the rally.
Note that the chart from Thursday and was used in my newsletter. Friday’s action saw little change.
Thanks for reading. Reach out to me at arbetermark@gmail.com for inquiries about my newsletter “On The Mark”, if interested.
Twitter: @MarkArbeter
The author holds a long position in GDXJ at the time of publication. Any opinions expressed herein are solely those of the author, and do not in any way represent the views or opinions of any other person or entity.


