The last 2 months haven’t been kind to Gold bulls. The precious metal appeared to be breaking out in early September, but that breakout attempt failed miserably.
Today we’ll take a look at the chart of the Gold ETF and provide an update.
SPDR Gold Shares ETF (NYSEARCA:GLD)
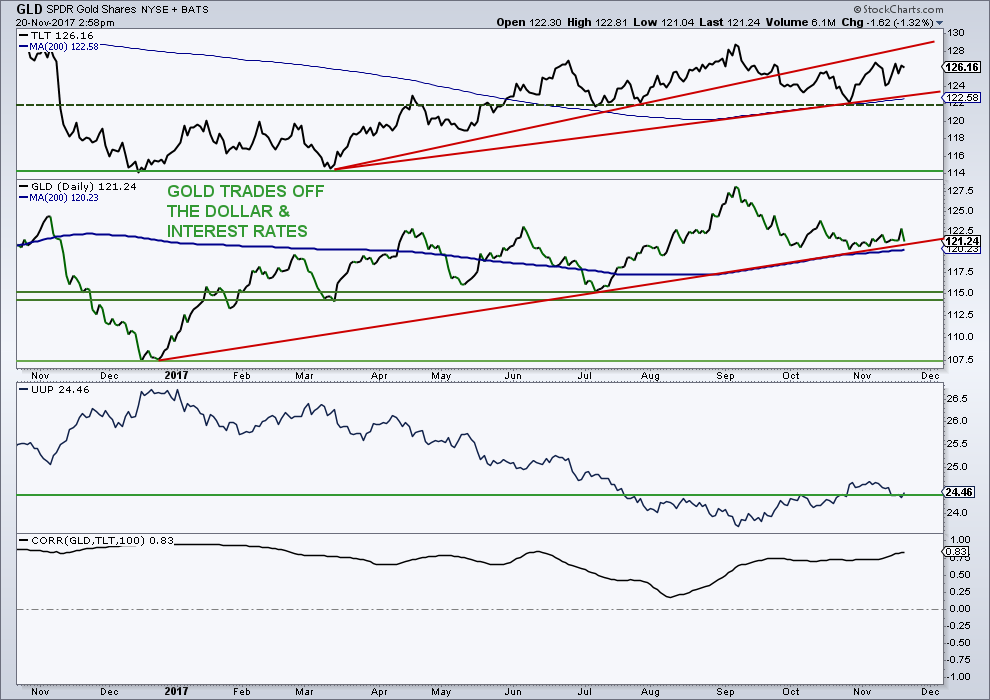
The Gold ETF (GLD) has broken back into the range it has traded in for much of the year ($115 to $123).
As mentioned in my opening comments, the August/September Gold breakout failed miserably. Many times, failed breakouts see price move back to the other end of the range. In this case, that would be $115.
Despite the recent rally in treasuries and little pullback in the U.S. Dollar Index, which should have been bullish for gold prices, the yellow metal has failed to gain any traction. The Commitment of Traders data (COT) remains bearish with commercial hedgers very bearish and large speculators fairly bullish. Sentiment is neutral so no edge there. I am currently short the market via the DUST ETF.
GLD Daily Chart vs Treasuries (TLT) and the Dollar (UUP)
ALSO READ: S&P 500: Price Targets For Next Year
Feel free to reach out to me at arbetermark@gmail.com for inquiries about my newsletter “On The Mark”. Thanks for reading.
Twitter: @MarkArbeter
The author is short gold via a position in DUST at the time of publication. Any opinions expressed herein are solely those of the author, and do not in any way represent the views or opinions of any other person or entity.


