Inflation is at its highest level in several decades and precious metals bulls are patiently waiting for a big win.
Geopolitical concerns are also rising with the ongoing Russia-Ukraine war. These factors would appear to be bullish for gold… YET the price of gold hasn’t done much.
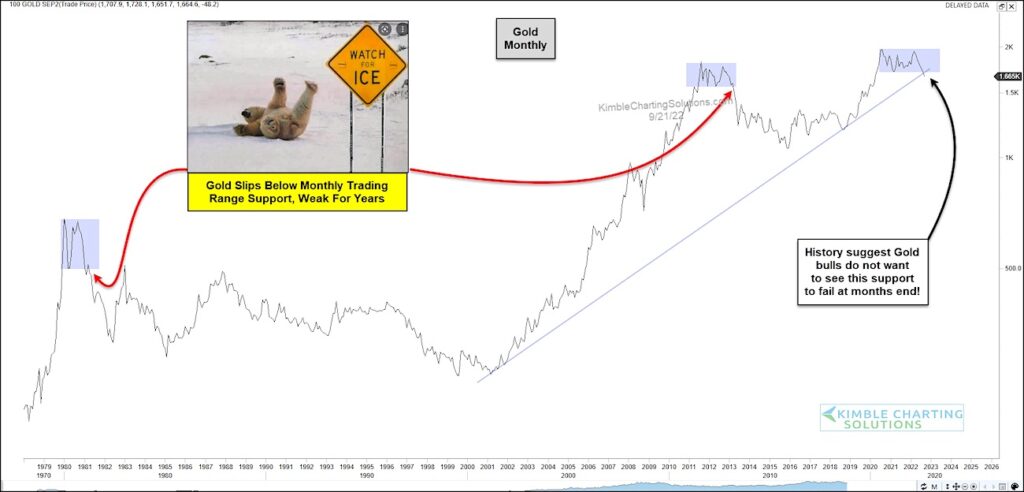
Today we look at a long-term “monthly” line chart of the price of gold. It offers a macro-technical look at the precious metal.
As you can see, gold has traded sideways for the past 2 years (blue shade). This is reminiscent of two other periods where gold saw trading “range” support breakdown and gold was week for years thereafter. So recent weakness is raising concerns for bulls.
Gold is also testing its long-term trend support line, making this price area even more important.
To put it bluntly, if history is any guide, Gold bulls don’t want to see this support fail. Stay tuned!
Gold “monthly” Line Chart

Note that KimbleCharting is offering a 2 week Free trial to See It Market readers. Just send me an email to services@kimblechartingsolutions.com for details to get set up.
Twitter: @KimbleCharting
Any opinions expressed herein are solely those of the author, and do not in any way represent the views or opinions of any other person or entity.


