The precious metals sector has remained elevated, yet volatile, over the past two years. Call it consolidation, but in my humble opinion, something has got to give.
Inflation, war, politics… gold bulls have the catalysts and tailwinds to see higher prices.
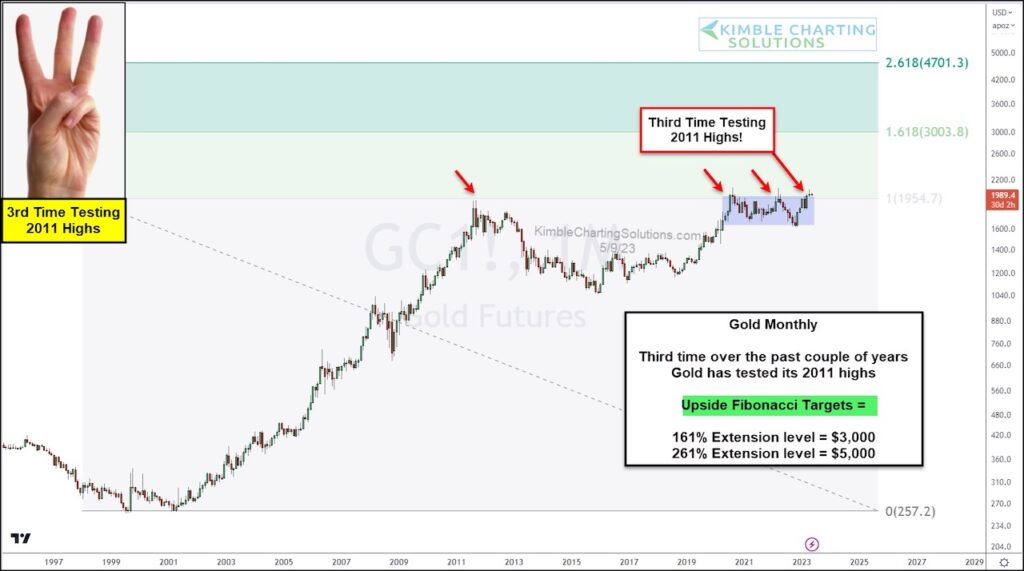
Today, we look at a long-term “monthly” chart of gold. As you can see, gold is testing breakout resistance for the third time over the past two years (see red arrows).
Over the years, I’ve heard that the more times an asset tests resistance, the more likely it is to take it out. If gold does break out, Fibonacci extension price targets include $3,000 (161%) and $5,000 (261%).
Seems like an important price area for bulls and bears to monitor. Will “see if the “third time be a charm” for Gold? Stay tuned!
Gold “monthly” Chart
Note that KimbleCharting is offering a 2 week Free trial to See It Market readers. Just send me an email to services@kimblechartingsolutions.com for details to get set up.
Twitter: @KimbleCharting
Any opinions expressed herein are solely those of the author, and do not in any way represent the views or opinions of any other person or entity.

 Pressuring Lower Price Support")


