The past 50 years have seen gold prices trading up and down but within a rising trend channel.
Several things impact the price of gold, including the US Dollar, economy, war, uncertainty, etc.
Our current environment is filled with concerns about all of the above. And so it’s unsurprising to see gold surging over $2500/oz.
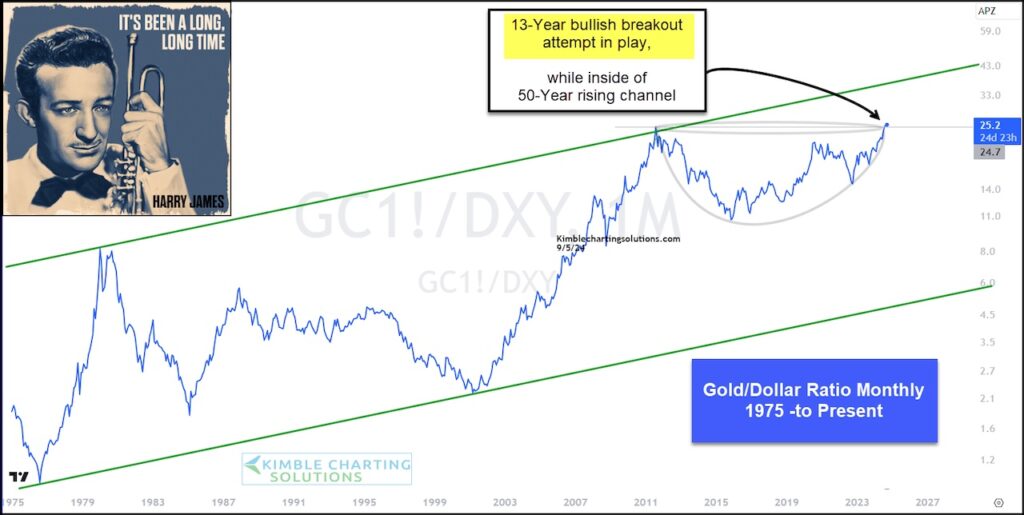
Today, we look at a long-term “monthly” ratio chart of Gold to the U.S. Dollar to highlight another potentially bullish confirmation signal for gold.
As you can see, the ratio is attempting a 13-year breakout within a 50-year rising channel.
If this breakout is successful, it would bode well for precious metals… and likely send gold much higher yet. Stay tuned!
Gold Price to U.S. Dollar Ratio “monthly” Chart
Note that KimbleCharting is offering a 2 week Free trial to See It Market readers. Just send me an email to services@kimblechartingsolutions.com for details to get set up.
Twitter: @KimbleCharting
The author may have a position in mentioned securities. Any opinions expressed herein are solely those of the author, and do not in any way represent the views or opinions of any other person or entity.
: Creating Bullish Divergence?")


 and Semiconductors (SMH): Concerning Price Pattern?")


