It’s been a heck of a year for precious metal bulls. Gold (NYSEARCA:GLD) has outperformed in 2016 after several years of underperformance. And this has lifted the Gold Bugs spirits, providing a huge tailwind for the Gold Miners (NYSEARCA:GDX).
Today, I want to highlight the incredible comeback of the Gold Bugs Index… and what the gold bugs outperformance may mean for investors going forward.
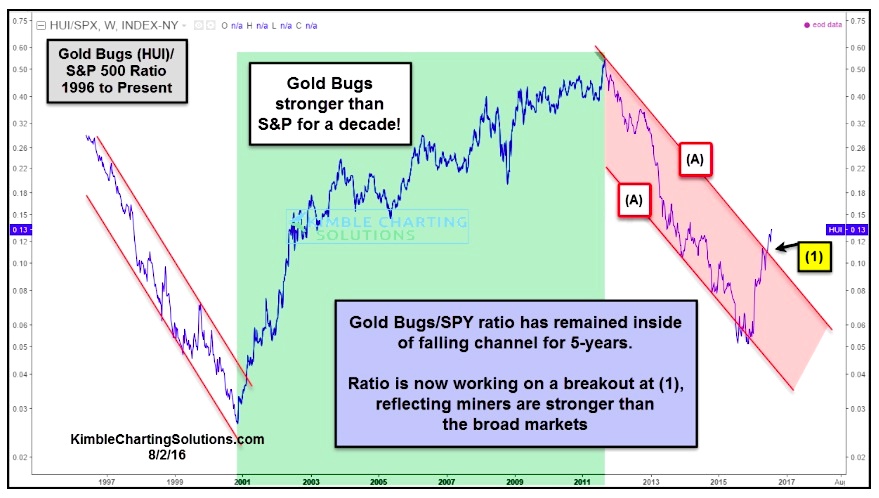
In the chart below, we plotted the ratio of the Gold Bugs Index (HUI) vs the S&P 500 Index. This provides us with a broad view of the how the Gold miners have performed versus large-cap equities over the past two decades. As you can see below, the Gold Bugs Index outperformed the broader equities market from 2001 to 2011. But that outperformance gave way to a period of significant underperformance.
Focusing on the red-shaded channel below, you can see how the decline formed (and respected) its descending channel – marked by points [A]… that is, until 2016.
That’s when the Gold Miners turned on their engines and hit the gas pedal. A sharp reversal higher (outperforming equities) began to take shape just as the clock turned 2016!
In fact, the comeback has seen the Gold Bugs Index breakout (relative to equities) above channel resistance. Although the miners may be due for some cooling off, it’s worth noting that if this trend change resembles recent turns, it may last a while longer yet.
Gold Bugs Index (HUI) vs S&P 500 Index Performance Ratio – 1996 to Present
Thanks for reading and best of luck out there.
More from Chris: Junk Bonds Rally Hits Key Price Resistance
Twitter: @KimbleCharting
The author does not have a position in related securities at the time of publication. Any opinions expressed herein are solely those of the author, and do not in any way represent the views or opinions of any other person or entity.


