The Australian Dollar has been in a prolonged slump since 2011, when it topped along side precious metals Gold and Silver.
We mention that because the Aussie Dollar (AU$) has been known to trade with in sync with precious metals (acting as a solid market “tell” for investors).
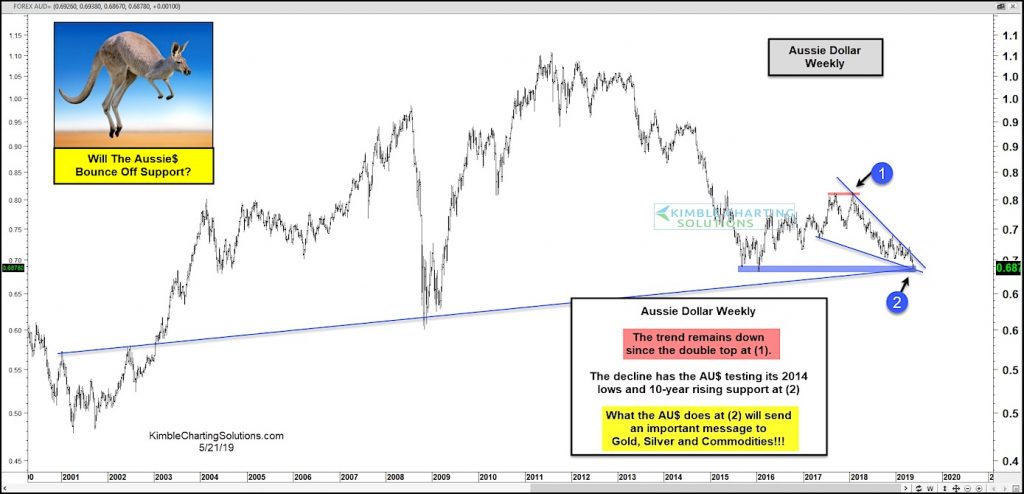
In today’s chart, you can see that the Aussie Dollar is testing a confluence of support that looks to be quite important.
This support area is made up of a rising trend line, lateral price lows, and a falling bullish wedge pattern.
Aussie Dollar bulls, along with precious metals bulls (and commodities in general) hope that the AU$ finds support here and begins to rally.
What it does next could highly impact Gold, Silver and Commodities. Stay tuned!
Australian Dollar “Weekly” Chart
Note that KimbleCharting is offering a 2 week Free trial to See It Market readers. Just send me an email to services@kimblechartingsolutions.com for details to get set up.
Twitter: @KimbleCharting
Any opinions expressed herein are solely those of the author, and do not in any way represent the views or opinions of any other person or entity.
 Weakness Remains; Sell Rallies?")


 Is A Favorite AI Stock: What About Timing?")