Gold / Silver Miners Index (XAU) Chart
The rally in precious metals has been impressive.
Gold is up over 9 percent in 2020 and over 35 percent in the past 18 months. Silver is up nearly 4 percent in 2020 and over 25 percent in the past 18 months.
And when precious metals prices are strong, it provides a strong tailwind to gold and silver mining stocks.
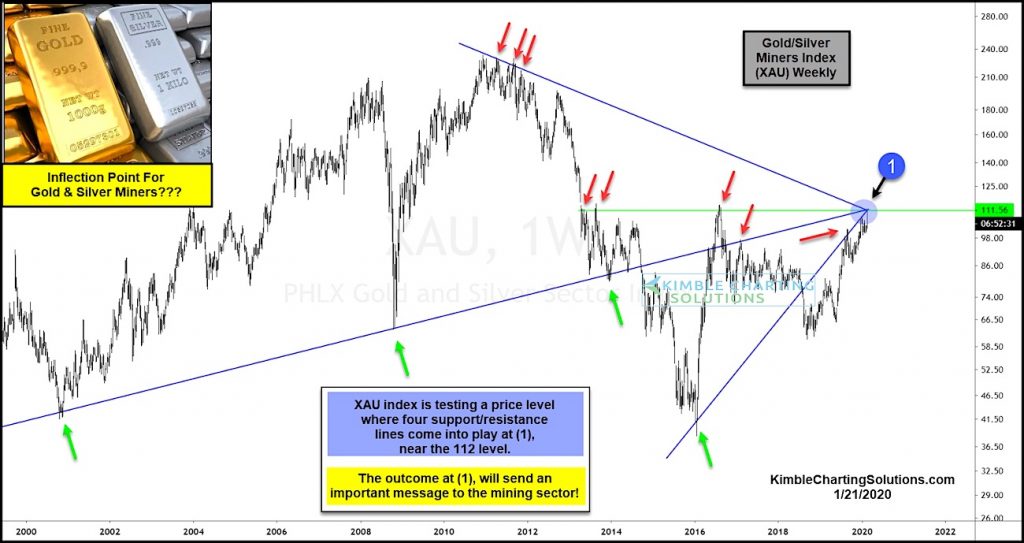
Today’s chart highlights the rally on the Gold & Silver Mining Index (XAU)… and why it’s nearing an inflection point.
XAU is testing a price level where four support/resistance lines come into play at (1), near the 112 level.
The outcome at (1) will send an important message to the mining sector as to whether the rally will pause and pullback, or continue higher. Stay tuned!
Note that KimbleCharting is offering a 2 week Free trial to See It Market readers. Just send me an email to services@kimblechartingsolutions.com for details to get set up.
Twitter: @KimbleCharting
Any opinions expressed herein are solely those of the author, and do not in any way represent the views or opinions of any other person or entity.


