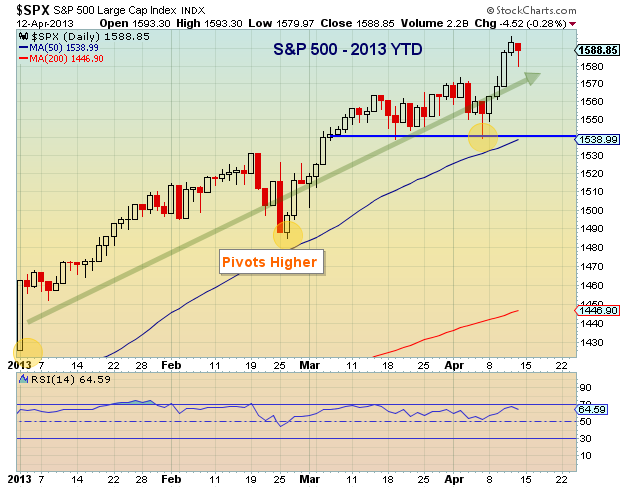
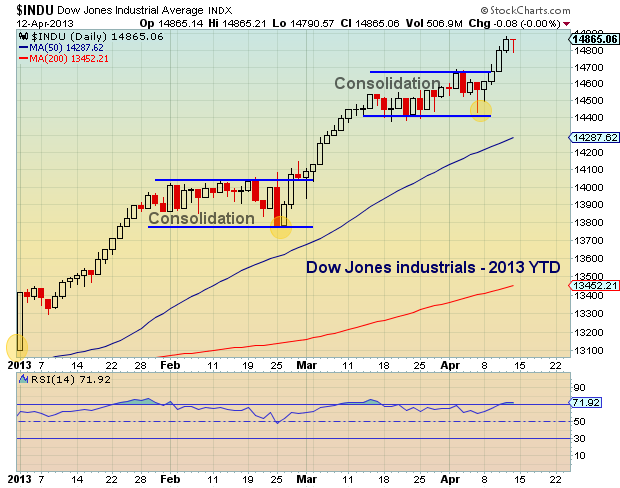
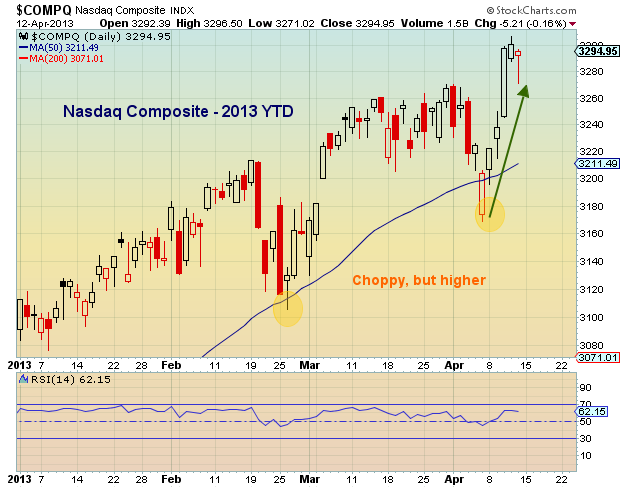
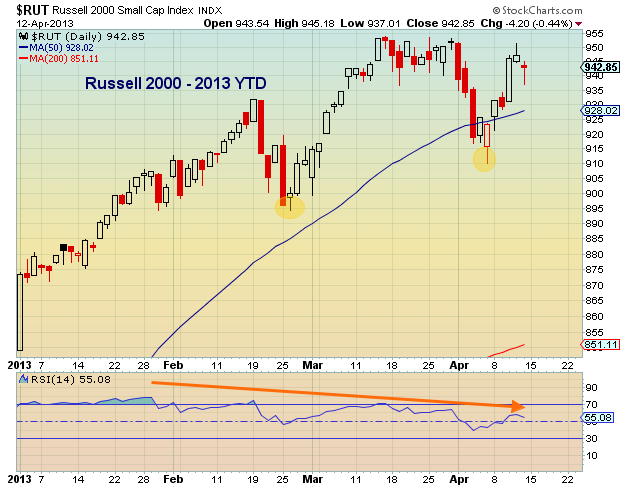
 By Andrew Nyquist It doesn’t take 20-20 vision to see that the U.S. stock market is off to a good start in 2013. Similar to last year, the U.S. equity markets came out of the gates kicking up dirt and racing for higher ground. More impressive, the U.S. markets have done this in the face of choppy global financial markets.
Each and every dip has been bought, and with each tick higher, a few more bears capitulate. Yes, the rally is long in the tooth, and yes, “Sell in May” seasonality is nearing, but the market’s historic run to new all-time highs deserves our respect.
With that said, let’s take a year-to-date look across the global financial markets, in pictures… starting with the U.S. equity indices.
S&P 500
Dow Jones Industrials
Nasdaq Composite
Russell 2000
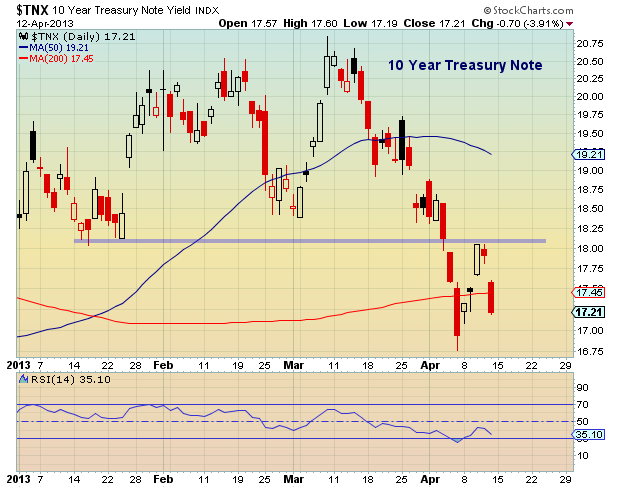
A quick look at Treasuries…
10 Year US Treasury Note
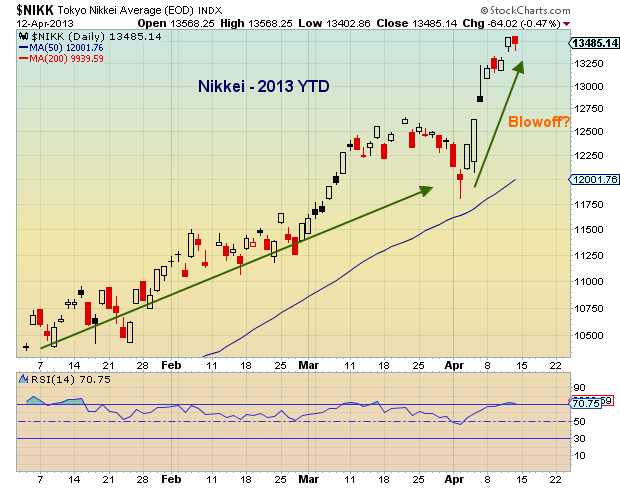
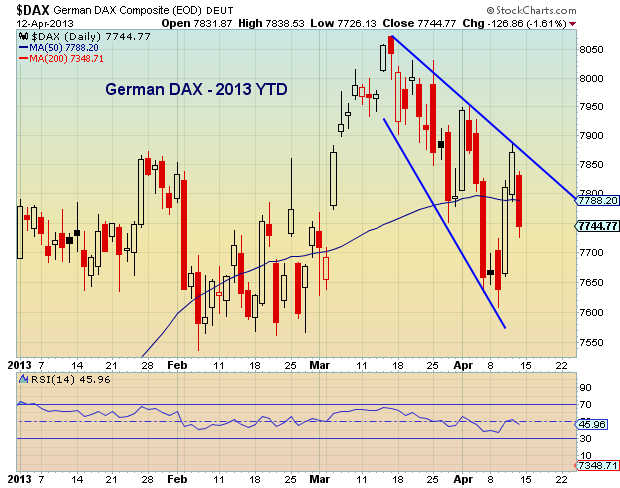
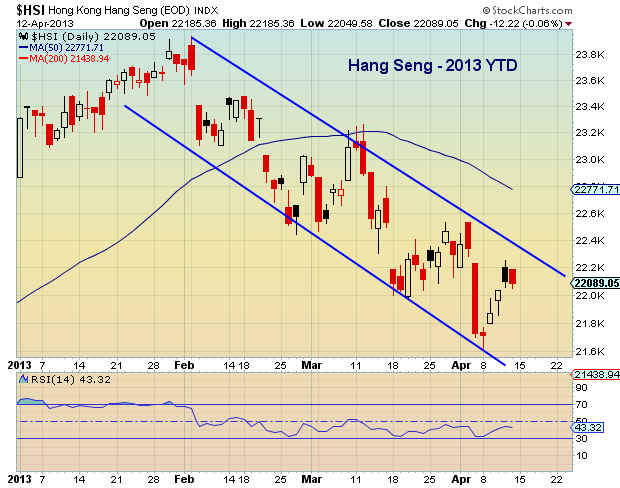
Now, let’s look at some relevant Global Equity Indices.
Nikkei Average (Japan)
DAX (Germany)
Hang Seng Index (China)
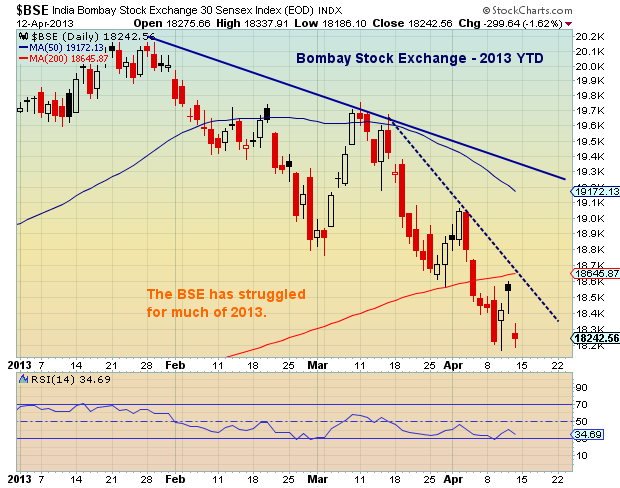
Bombay Stock Exchange 30 (India)
Time for a look at Commodities performance in 2013.
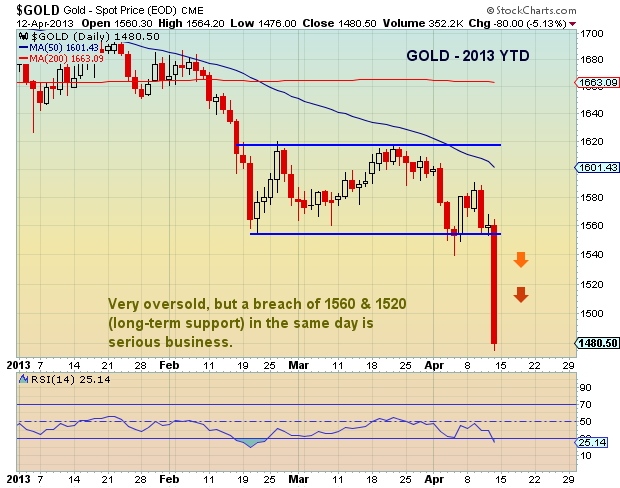
Gold (spot price)
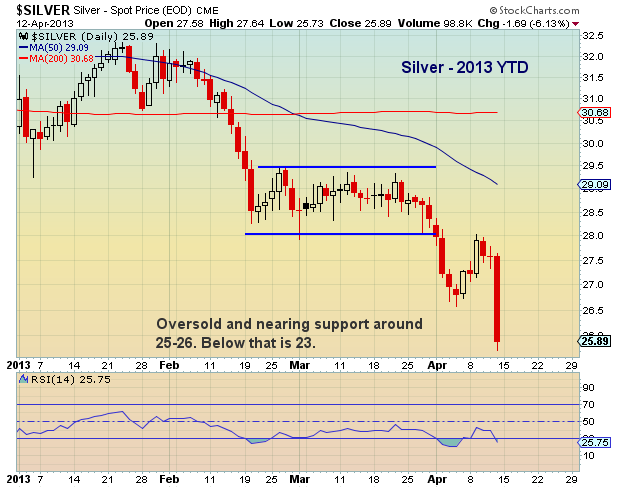
Silver (spot price)
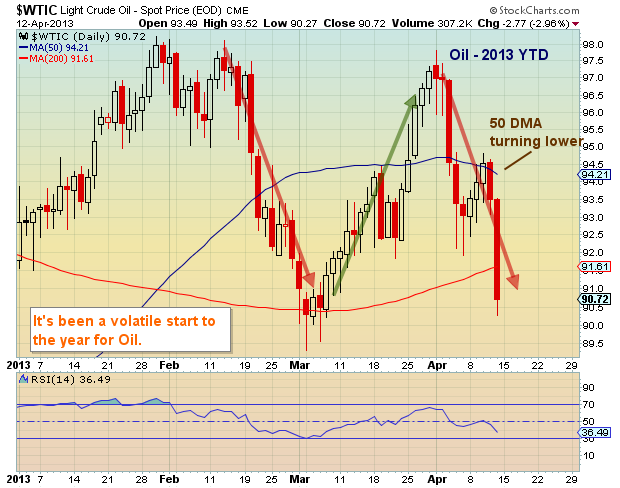
Light Crude Oil (spot price)
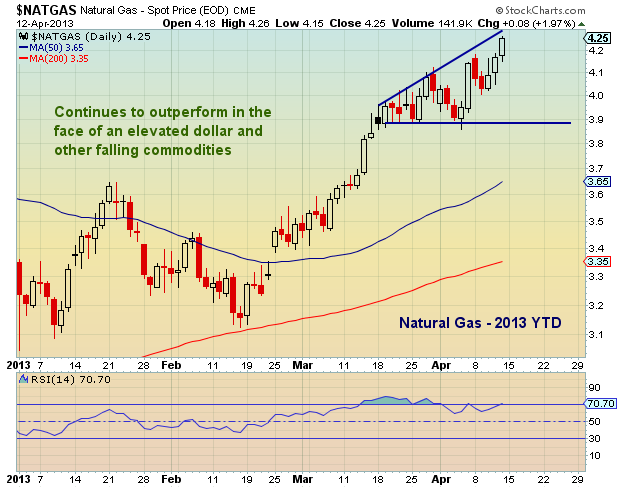
Natural Gas (spot price)
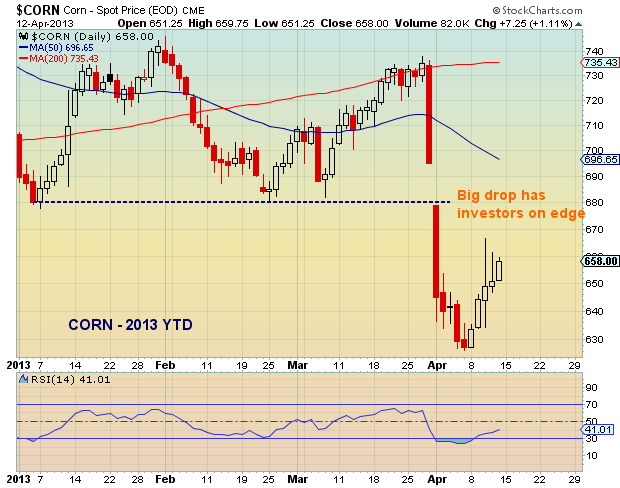
Corn (spot price)
Finally, let’s take a look across a few global currencies.
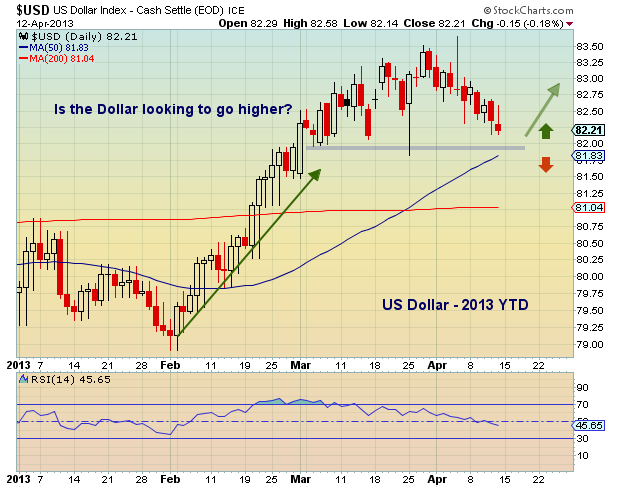
U.S. Dollar
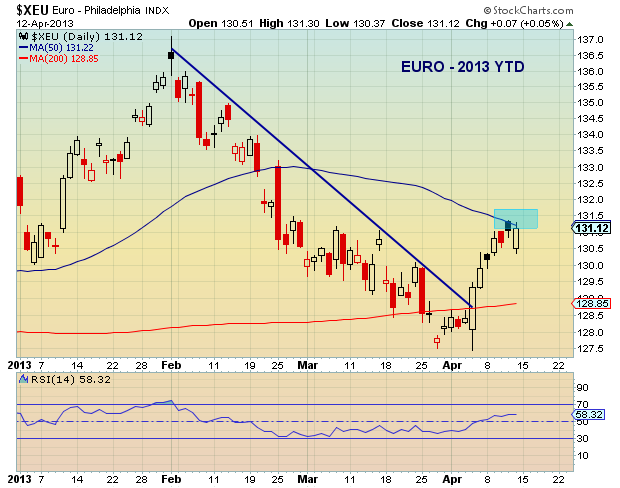
Euro
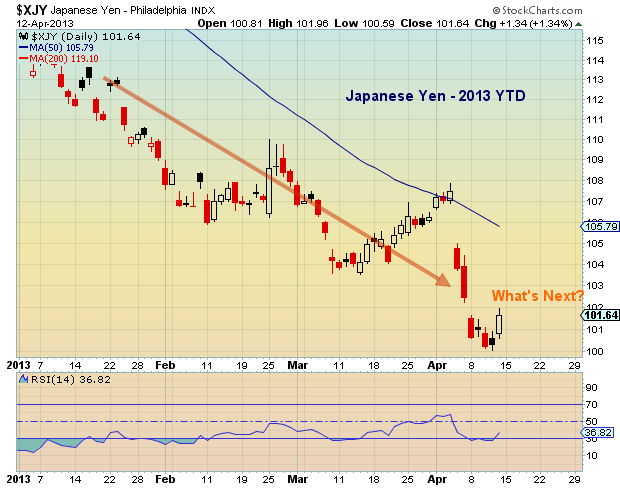
Japanese Yen
Invest smart, stay disciplined.
Twitter: @andrewnyquist and @seeitmarket

