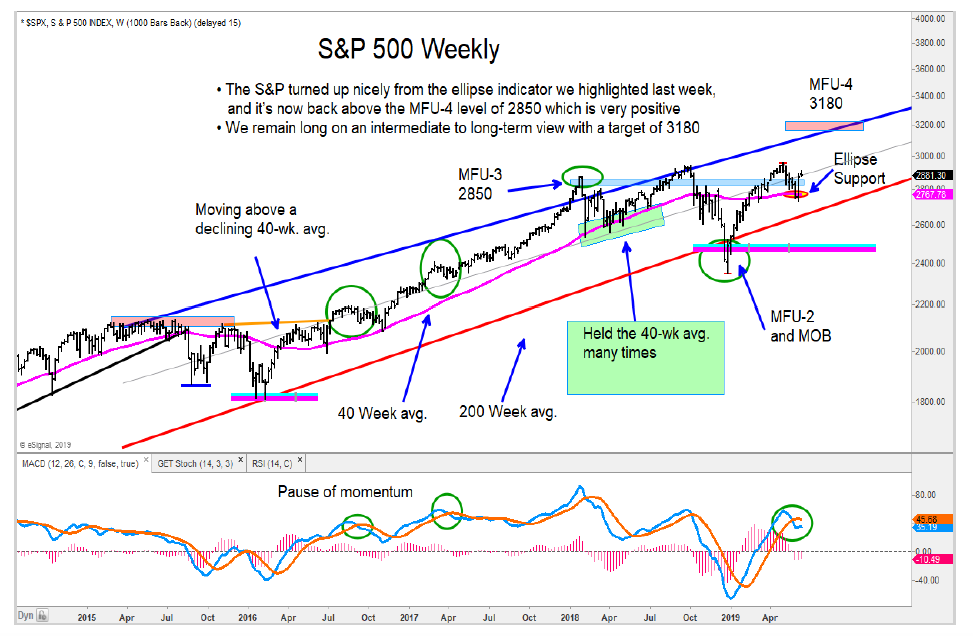
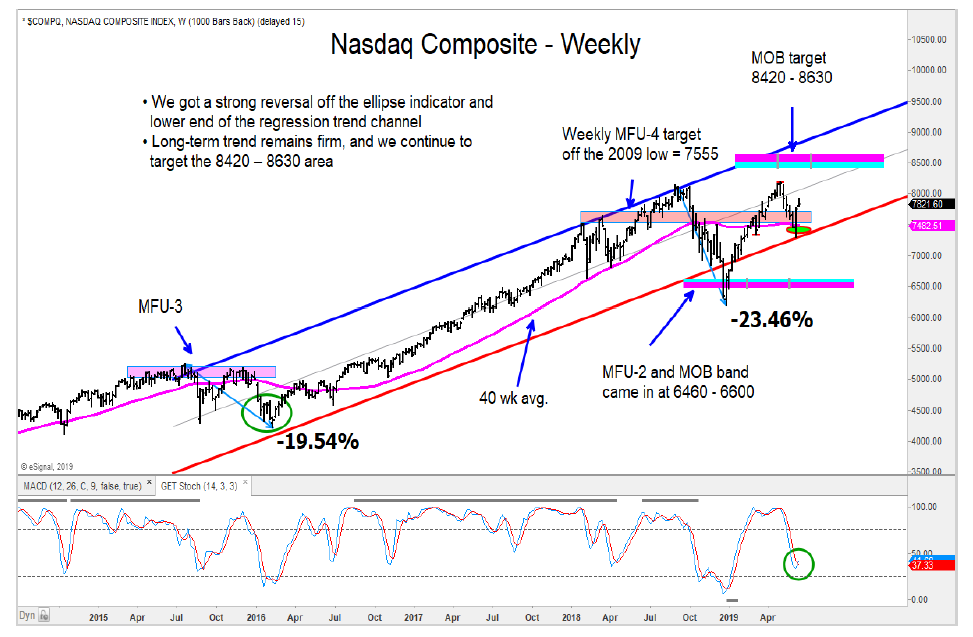
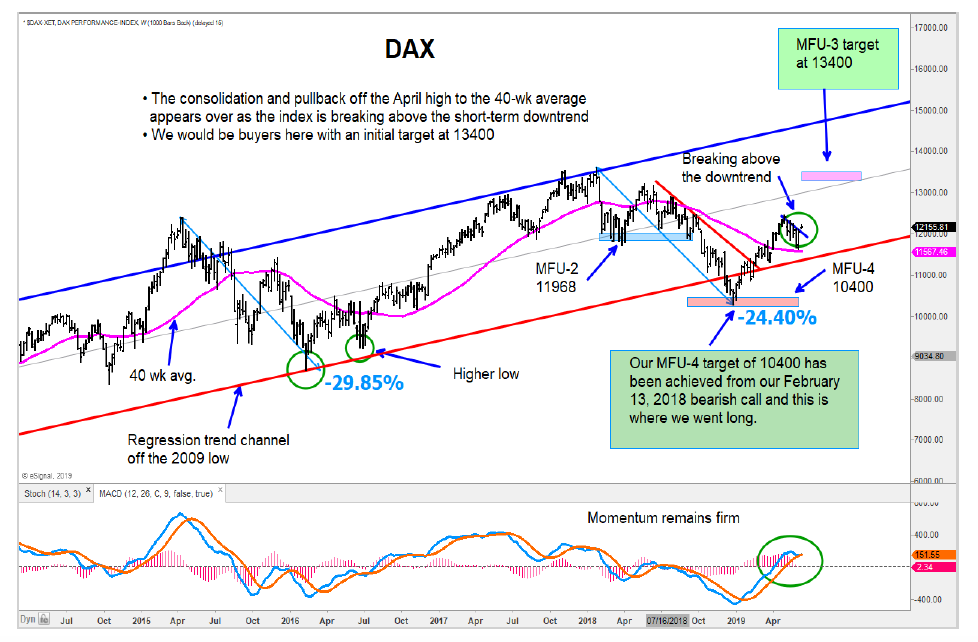
A number of U.S. stock market indices have reversed sharply off support and target zones as defined by long-term moving averages and/or our ellipse turning point indicator.
Though there is some stalling out short-term, I believe the market is bullish intermediate term.
Our intermediate to long-term views have not changed, and we remain bullish on most of what we are reviewing.
Momentum indicators on the Nasdaq Composite and S&P 500 have been very strong off the recent low. The move higher has been very strong and fast, producing a short-term overbought condition.
I believe we will see more of a pause than a deep pullback from here.
Let’s review a few charts of major stock market indices around the world. The charts are annotated and include potential forecasts / price targets should support levels continue hold.
S&P 500 Index

NASDAQ Composite

In Europe, both the German DAX and France CAC have broken above short-term downtrends, and I would think about adding here. My research says to get long the Copenhagen OMX 20 index, as we see the potential for a significant move higher.

The Aussie All Ordinaries is up about 21% from the MOB target band off the December low and is now approaching our MFU-4 target area. Both the Nikkei and China’s Shanghai Composite have turned up from support zones, and we remain long.
The author may have a position in mentioned securities at the time of publication. Any opinions expressed herein are solely those of the author, and do not in any way represent the views or opinions of any other person or entity.


