General Electric stock (NYSE: GE) has been trading like a falling knife. It’s been a rough past couple years for investors.
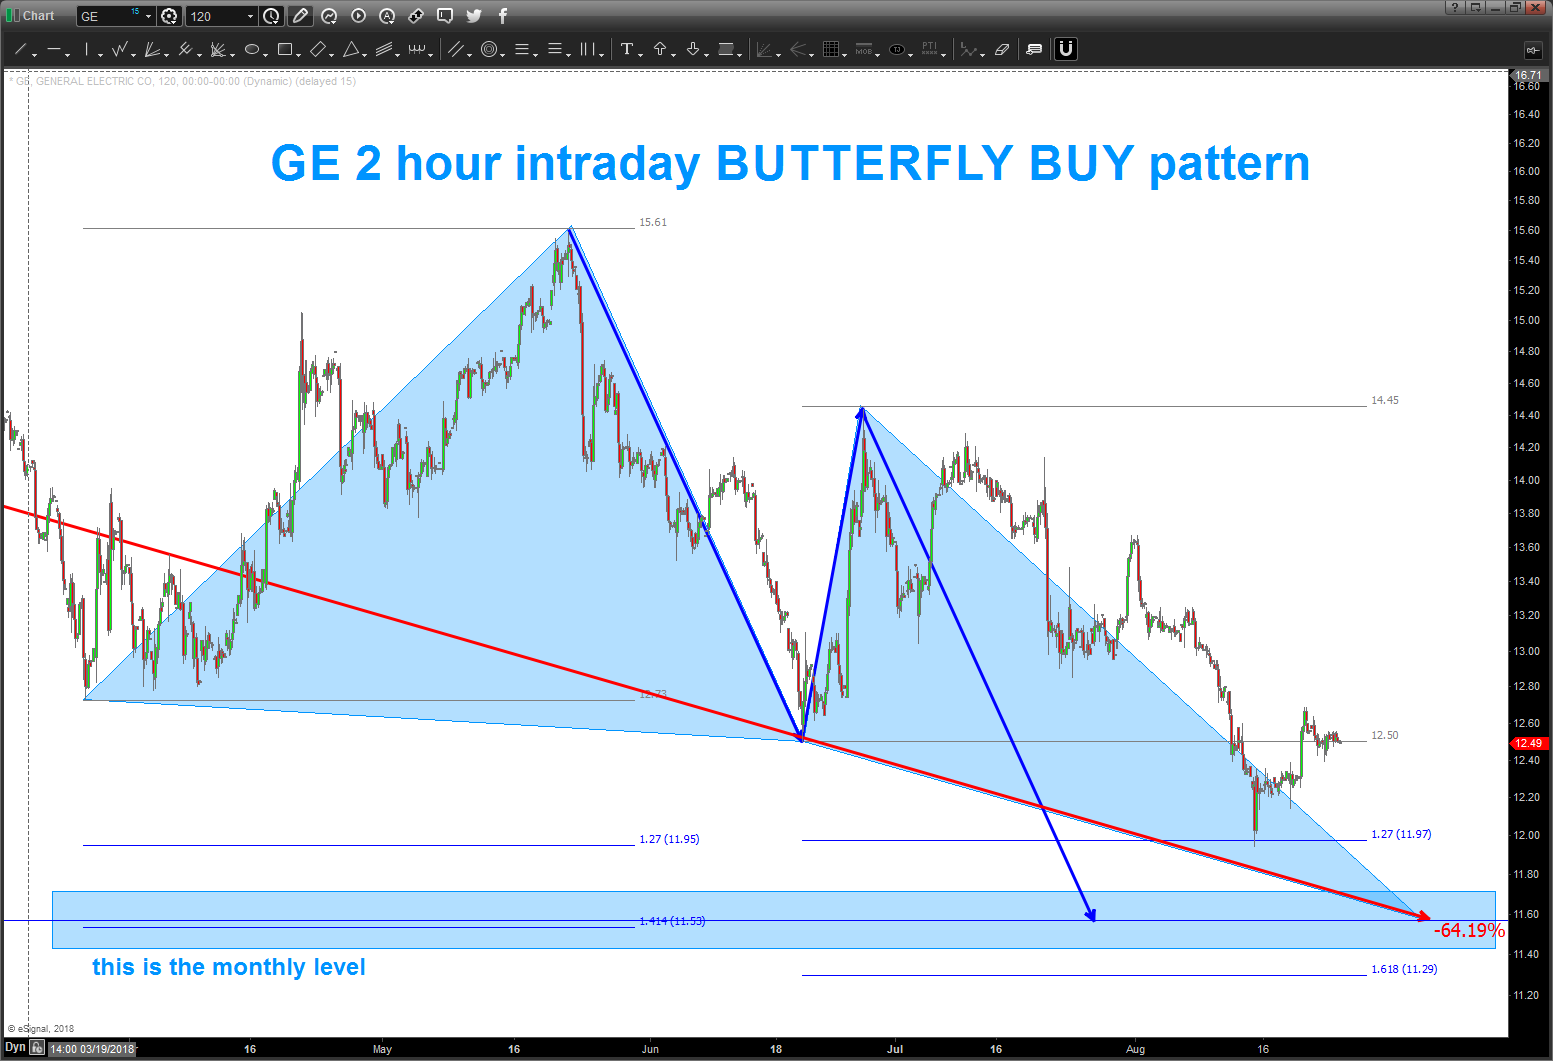
That being said, it is in such an oversold condition that it popped up on my radar. And I noticed an interesting GE stock buy pattern…
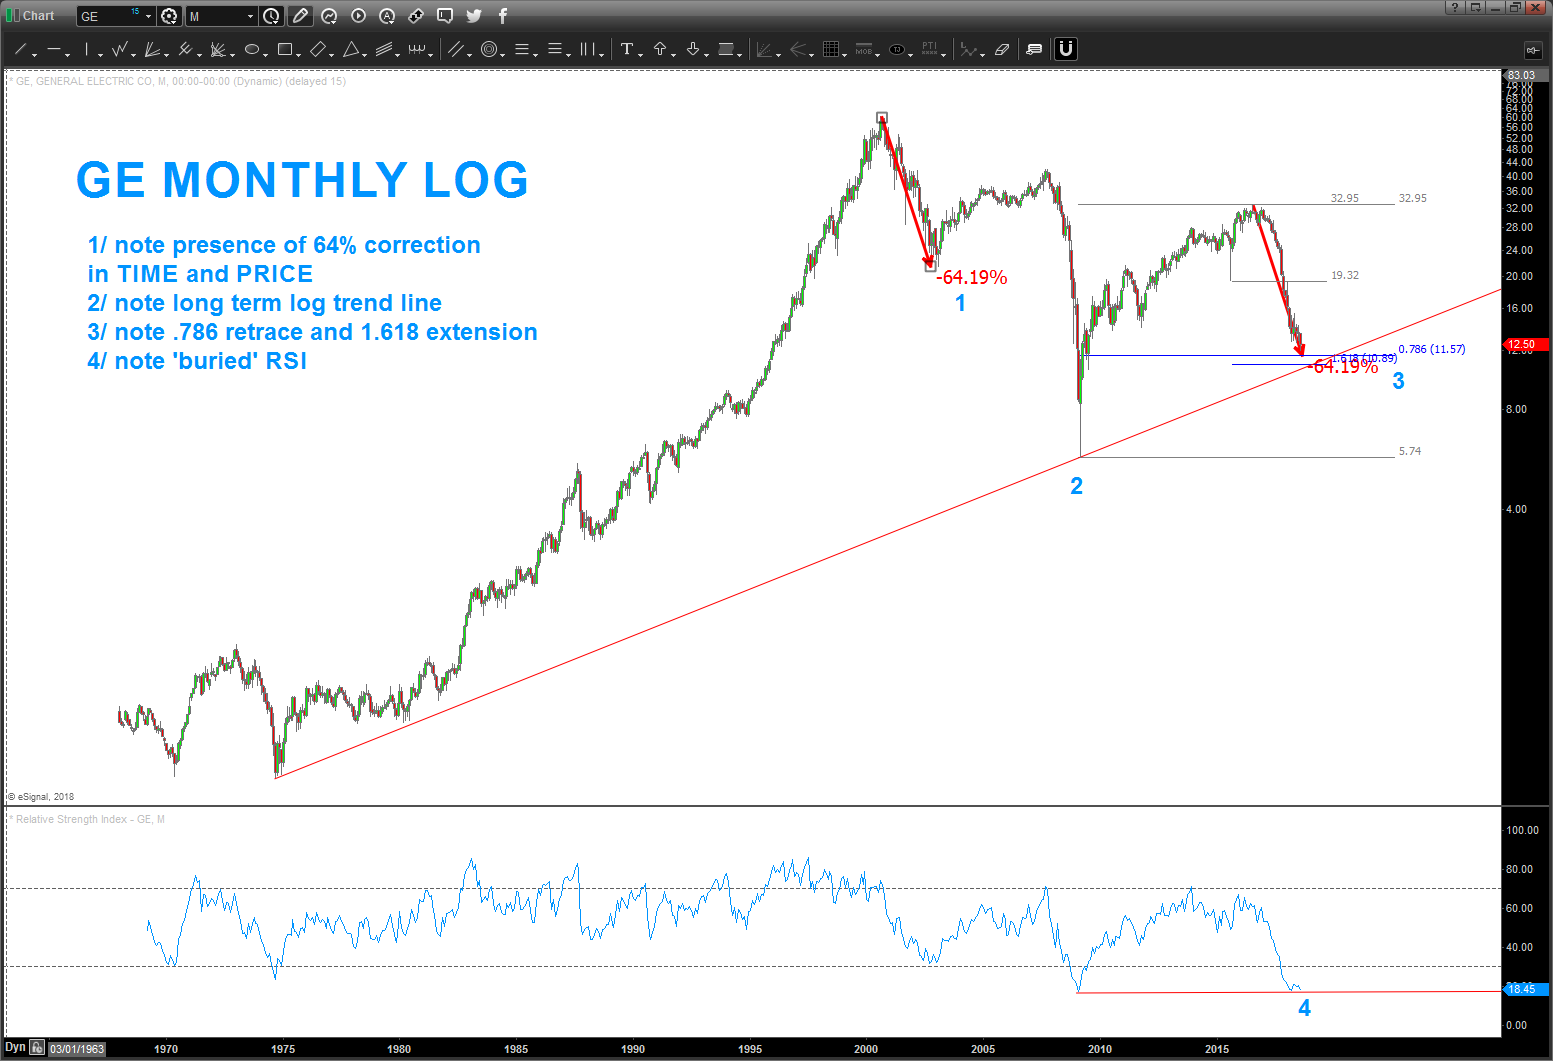
In addition to being oversold, multiple technical indicators are pointing to a potentially nice risk-controlled buy in and around the 10 to 11 dollars mark.
Additionally, the daily time frame analysis is melding into the monthly time frame, offering the potential for a strong rally.
In drilling down into the two-hour candle chart, we can see a PATTERN called a butterfly (in this case a BUY pattern). It happens to complete in and around the monthly levels shown on the monthly chart. Looks like a solid GE stock buy pattern.
Therefore, a lot of math is coming into play around the $10-$11 area for a potential “big” bounce. I shouldn’t have to remind you, but stops required
Be sure to check out my unique analysis of stocks, commodities, currencies over at Bart’s Charts. Stay tuned and thanks for reading.
Twitter: @BartsCharts
Author does not have a position in mentioned securities at the time of publication. Any opinions expressed herein are solely those of the author, and do not in any way represent the views or opinions of any other person or entity.


