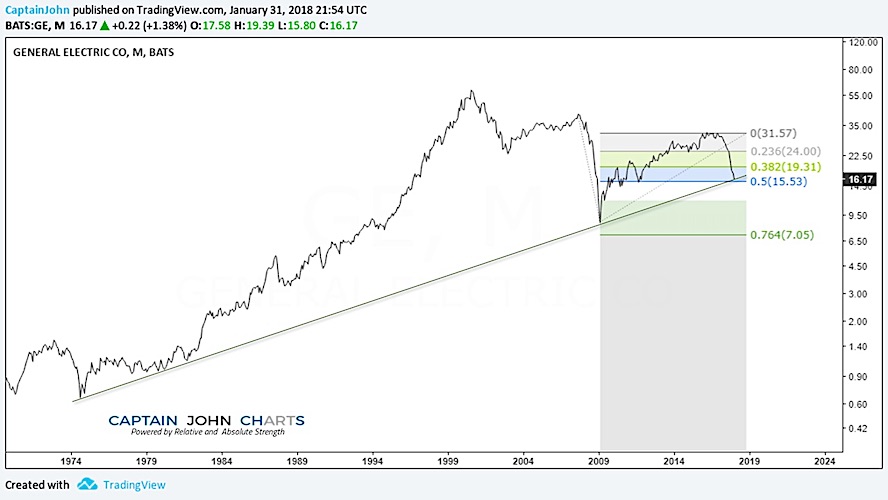
Last week, I highlighted how General Electric’s stock (GE) was testing long-term price support. And when I say long-term, I mean 44 year price support!
GE’s decline has been ugly, putting the stock out of favor for many funds and investors. However, there appears to be a glimmer of hope for General Electric stock.
Is GE Stock A Buy?
Today we’ll look at the monthly and daily charts for GE, highlighting what may produce a bounce / rally for the stock.
First, let’s discuss the monthly chart and prospects and price for a GE stock buy.
GENERAL ELECTRIC MONTHLY CHART
- GE stock price remains at long term, 44 year trend line support.
- Fibonacci price support nearby – price is close to 50% from the 2007 high to the 2009 low.
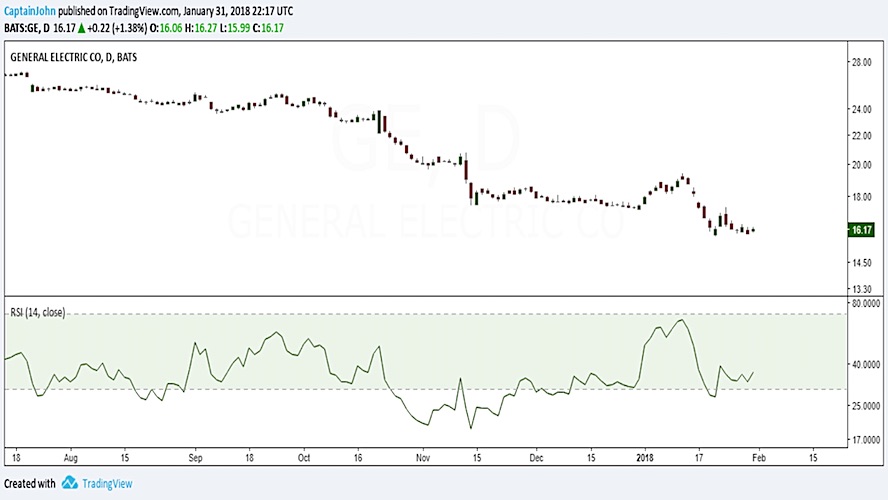
GENERAL ELECTRIC DAILY CHART
- Nested RSI momentum indicators seen at points (1) and (2) on the chart below are in tandem bullish configurations.
- A potential double bottom price pattern is in play.
If you are interested in learning more about our investing approach and financial services, visit us at CaptainJohnCharts.
Twitter: @CptJohnCharts & @FortunaEquitis
The author may have a position in mentioned securities at the time of publication. Any opinions expressed herein are solely those of the author, and do not in any way represent the views or opinions of any other person or entity.


