The British Pound appears ready to strengthen versus the US Dollar soon, if this Elliott wave analysis plays out to forecast.
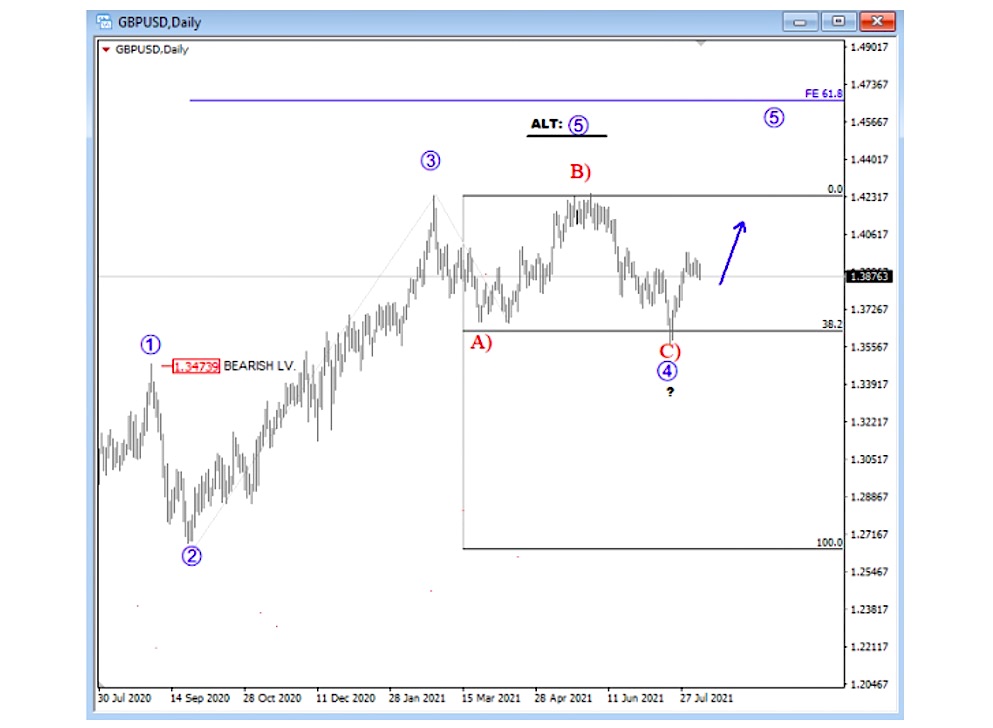
Following an A-B-C correction, the $GBPUSD currency pair is bouncing away from its 38.2% Fibonacci retracement support level (as expected). This suggests that wave four has ended and that a wave five is underway and likely to bring new yearly highs.
In the meantime, the 1.3474 area remains the invalidation level as wave four cannot trade into the territory of wave one. So be mindful of that trading level.
GBPUSD Daily Elliott Wave Analysis Chart

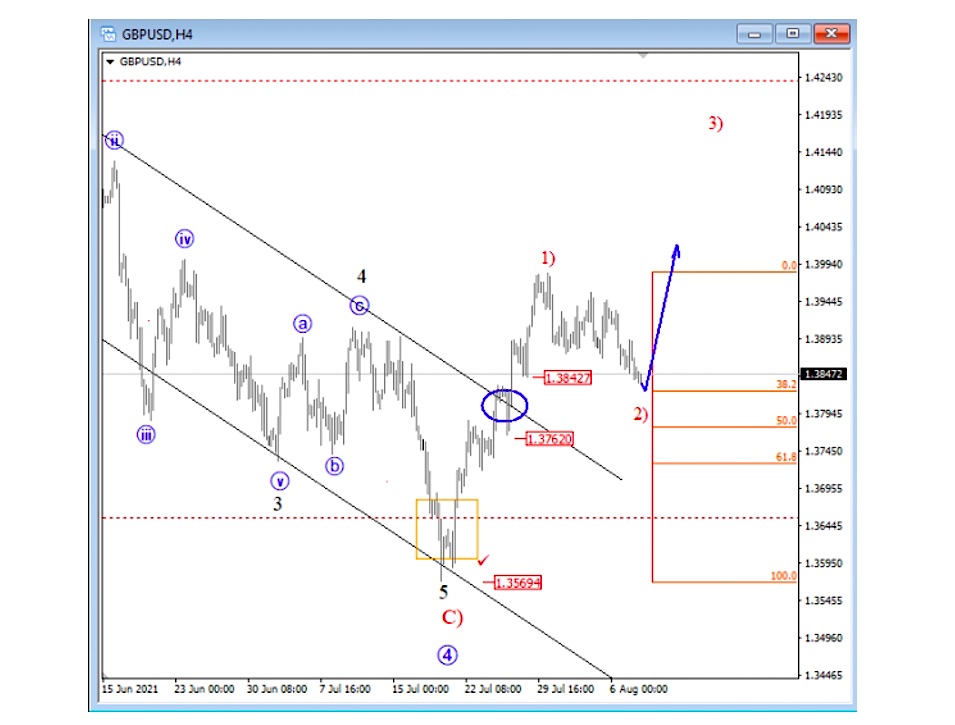
On the 4 hour trading chart, $GBPUSD has made a nice and impulsive recovery from recent lows. It is now trading back above its channel resistance line which suggests a bullish reversal and new rally within a five-wave cycle. With this in mind, I am expecting more upside after a wave 2 pullback. The first support is around 1.3842, while a secondary support can be found around 1.3762. $GBPUSD is short-term bullish as long as it’s trading above the 1.3569 low.
GBPUSD 4h Elliott Wave Analysis Chart

Twitter: @GregaHorvatFX
The authors may have a position in the mentioned securities at the time of publication. Any opinions expressed herein are solely those of the author, and do not in any way represent the views or opinions of any other person or entity.


