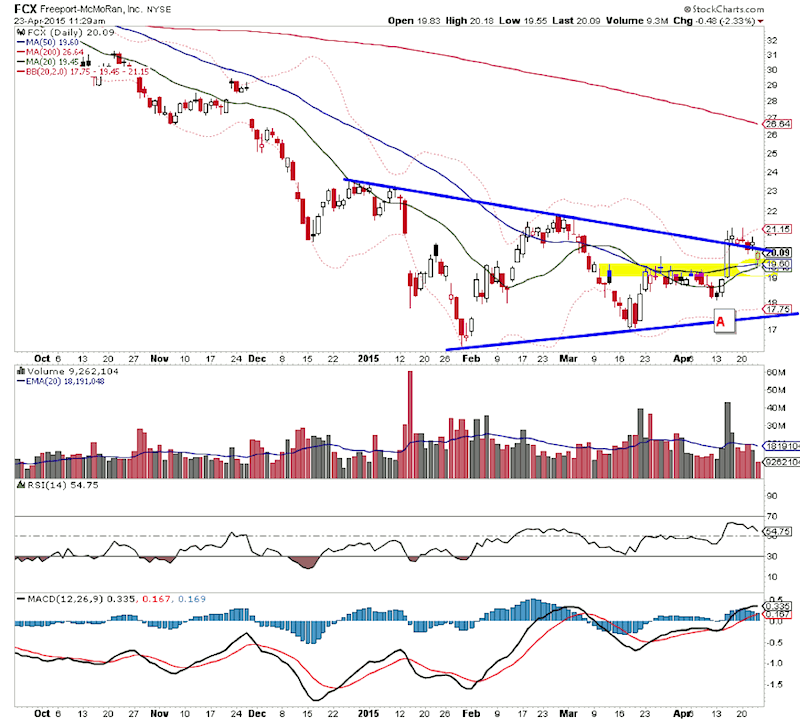
Freeport-McMoRan (FCX) reported earnings this morning and saw its stock dip lower out of the gate. The low for the day was 19.55, which is very close to an important price level that active investors should put on their radar.
Here are a few take aways:
- The flip from resistance to support at the 19.50ish area. It’s an area active investors can trade against.
- Today’s lows for FCX mark a test of the rising 20 and 50 day moving averages (which are also near the 19.50 area, and now support).
- If FCX can clear the April highs, a rally to 23 and even the 200 Day Moving Average (26+) is possible.
- Trading below 19.50 may turn the level back into resistance. This would be bearish.
- And if trendline A is lost, there’s no reason to own the stock.
Freeport-McMoRan (FCX) Stock Chart – Earnings Reaction
Trade ‘em well! And thanks for reading.
Follow Aaron on Twitter: @ATMcharts
No position in any of the mentioned securities at the time of publication. Any opinions expressed herein are solely those of the author, and do not in any way represent the views or opinions of any other person or entity.


