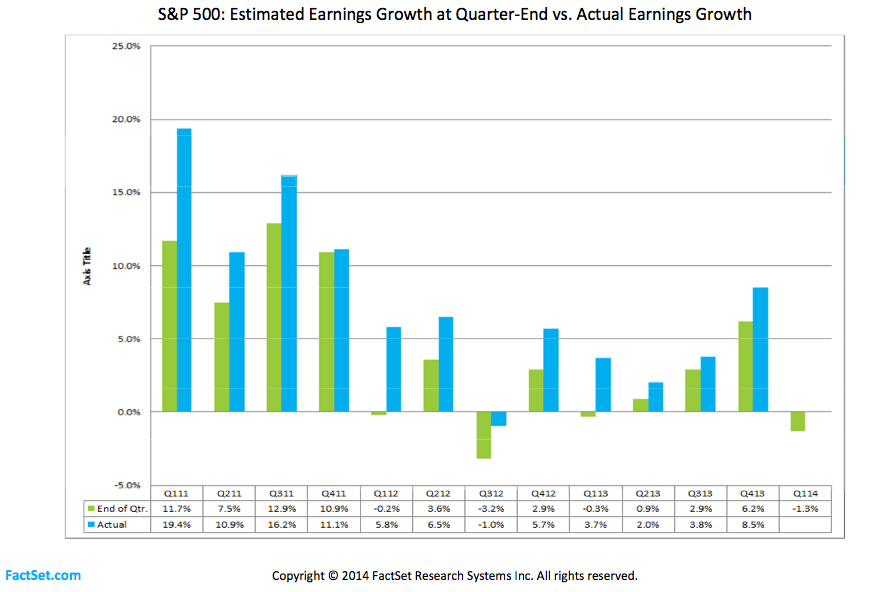
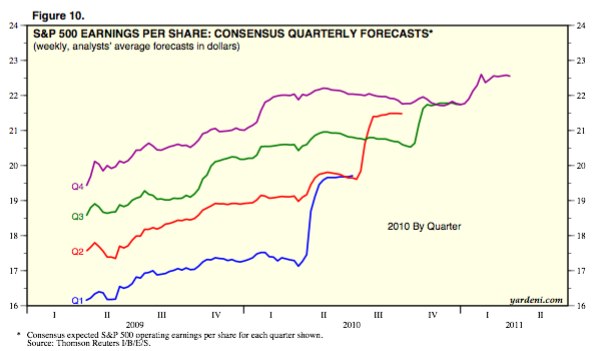
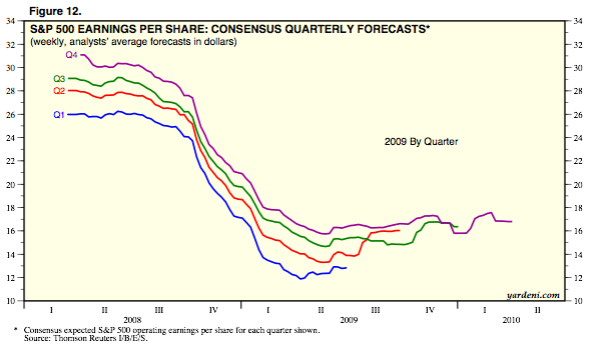
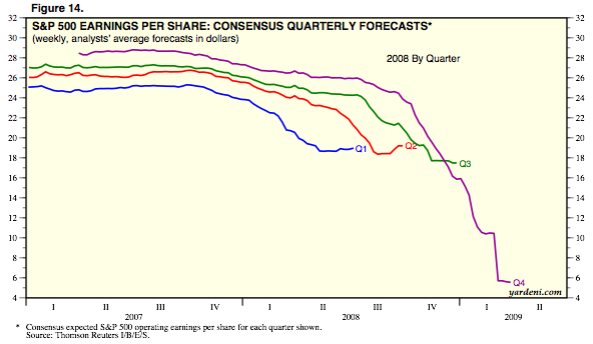
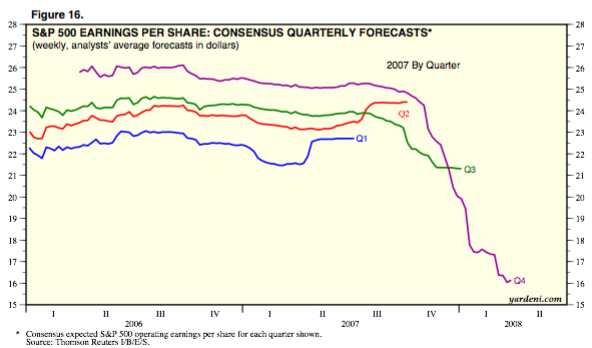
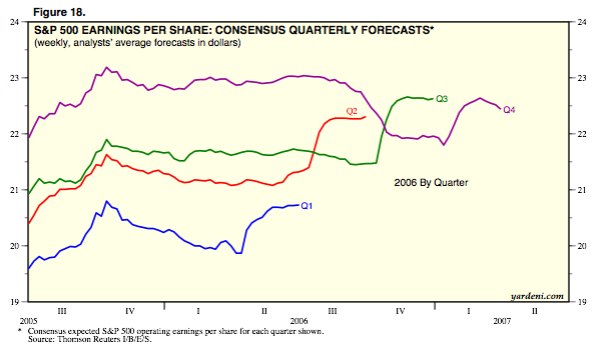
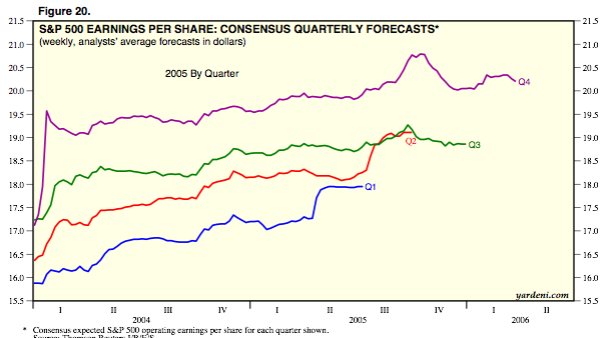
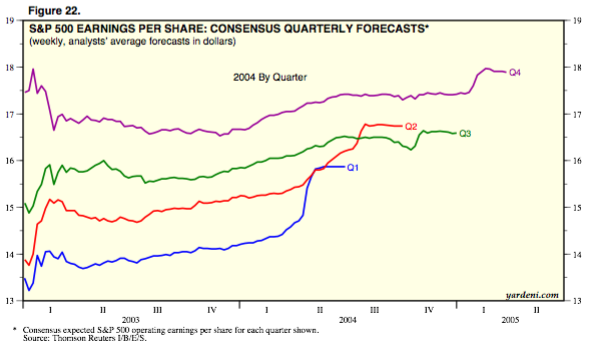
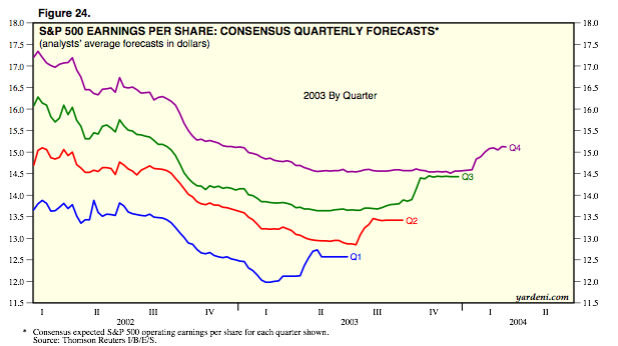
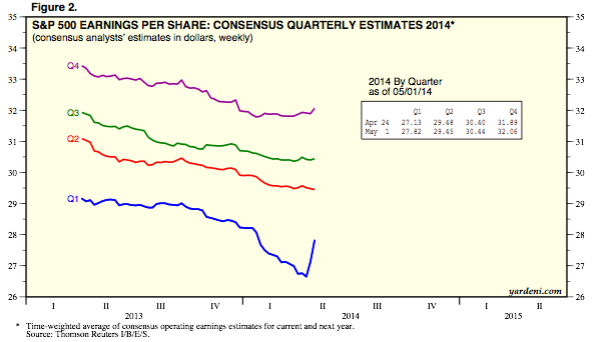
With over 90% of the S&P 500 (SPX) reporting through last Friday, Q1 2014 earnings season is effectively over. As Factset reports, of those companies “75% have reported earnings above the mean estimate” producing an upwardly revised EPS growth rate of +2.2%, cut in half from 12/31/2013’s +4.3% estimate just before the quarter begin; but far higher than the -1.3% growth projected on 03/31/2014 at quarter-end.
Inspired by the unusually negative “Snowpocalypse” punctuated Q1 EPS growth forecast at the end of March, last month Factset took a look at how negative estimates compared to actual earnings results over the previous 12 quarters (2011-2013). Their finding – of the three quarters that began with a negative EPS estimate, only one (Q3 2012) produced a final negative number:
Interesting as that is, the anomaly of a final negative EPS figure is symptomatic of another trend in EPS estimates that this charts drops a deafening hint regarding: they are always revised up during earnings season. Put another way, they are always far too low at quarter-end.
Maybe the breed of analyst covering SPX earnings is incurably cynical and haplessly stuck in a quarterly vocational groundhog day of pessimism, only to be happily met in the last analysis with positive surprise (appropriately, it’s much like the story arc of Dr. Seuss’s beloved Green Eggs & Ham). That might explain why the consensus is not only so consistently wrong, but able to choose the dark side of the earnings coin with a preposterously high success rate.
This trend of repetitive revision is well summarized by Factset’s observation that Q1 2014’s 75% “of companies reporting EPS above the mean EPS estimate is above the 1-year (71%) average and above the 4-year (73%) average”.
7.1 out of 10 over the last 4 times out? Hey, everyone (in this case, everyone at the same time) has a bad run now and then; and maybe something about 2013 called for stubborn negativity and/or ineptitude (a stock market at recurrent all-time highs can do that). But “positively surprised” in 7.3 out of 10 over the last 16 occurrences? Well, one can’t help but begin to wonder how bad (or how stupendously good) those putting out these estimates are at their job.
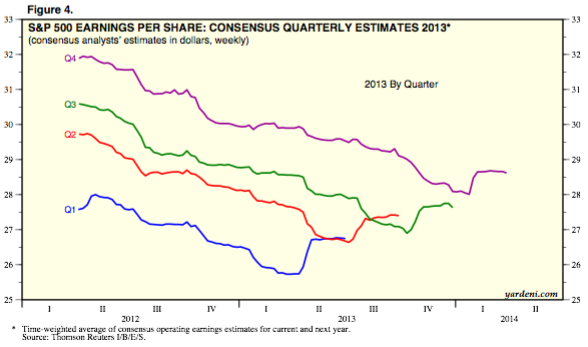
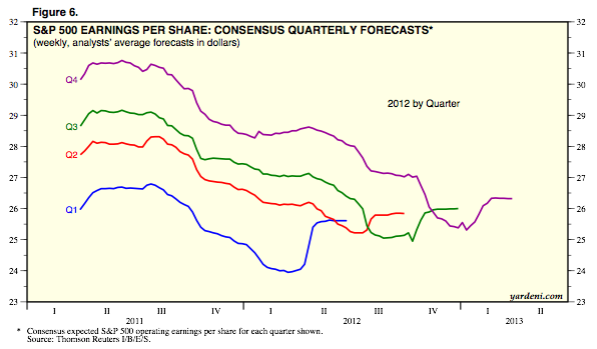
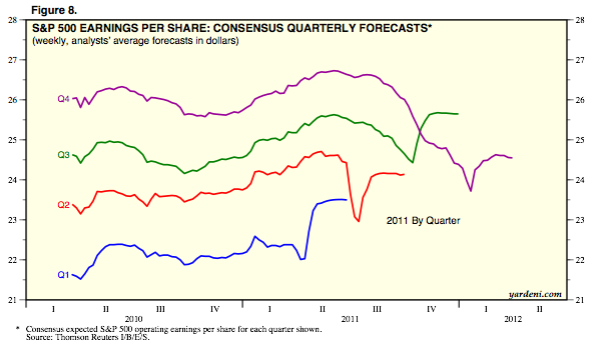
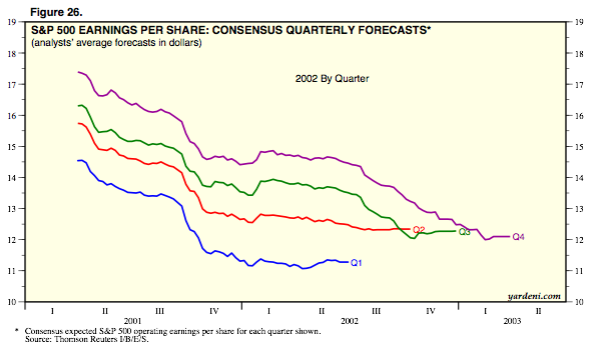
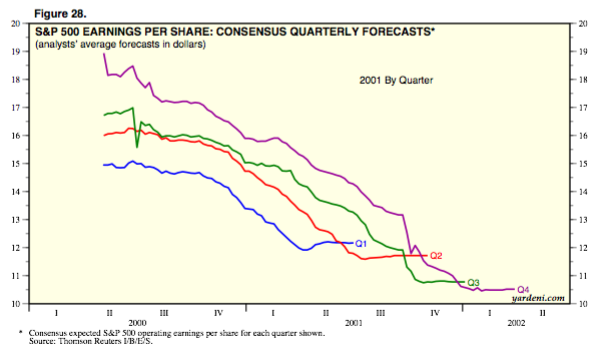
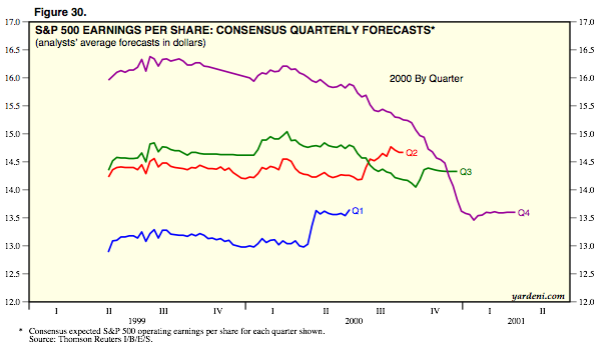
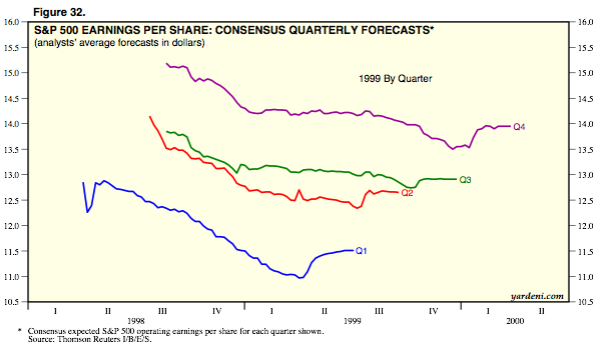
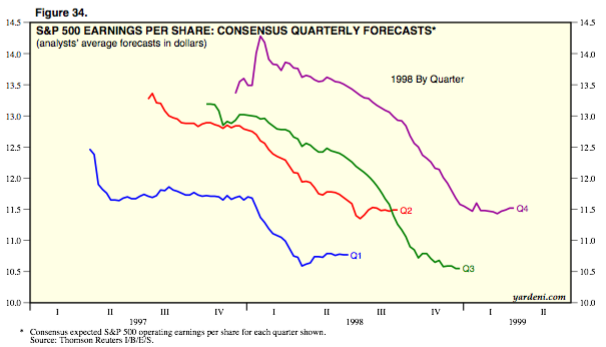
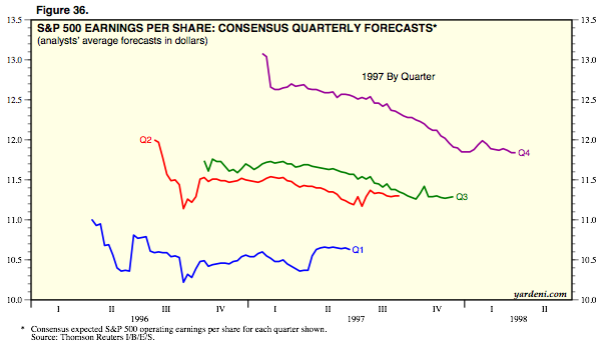
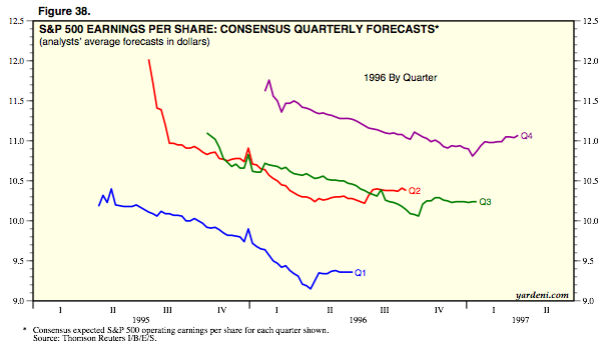
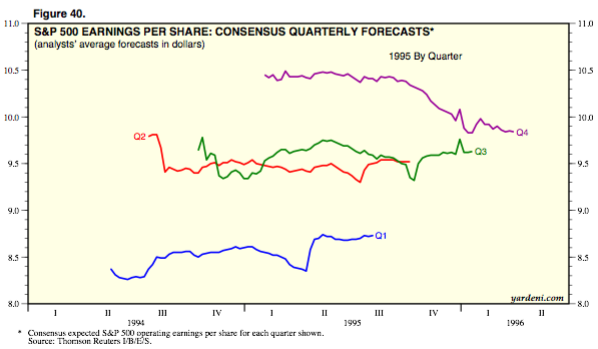
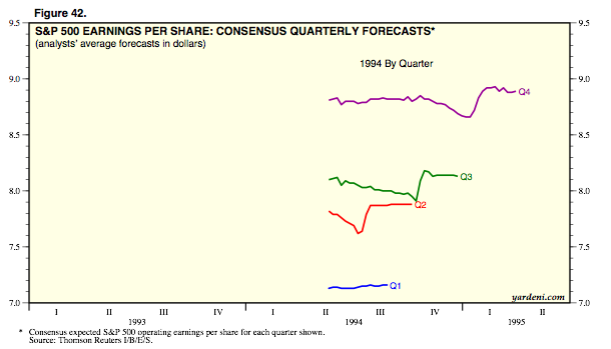
But why stop with the last 16 quarters: how about the last 80? Yardeni Research publishes a weekly update of “S&P 500 Earnings Squiggles” with charts covering 20 years’ worth of earnings seasons (1994-2014). To provide a streamlined view for quick scanning, I’ve included them below. With two major exceptions, you’ll notice flitting through that every quarter is preceded by a marked decline in EPS estimates – up until quarter end, where estimates are uniformly revised higher. Look no further than Q1 2014 for a fantastic example.
There is a major (and humorous) caveat to this: the only time consensus EPS estimates aren’t revised higher is during recession or financial crisis – presumably when they can’t be. Those periods in the last 20 years? Q2-Q4 1997 (Asian Financial Crisis), Q3-Q4 1998 (Russia/LTCM), Q2 2001-Q4 2002 and Q3 2007-Q4 2008. Yes, on occasion, the actual economy intervenes to alters the rules of the game.
The net result: roughly 375 of 500 companies consistently produce “positive EPS surprises” over 80% of the time since 1994. Are analysts as a class this inadvertently – and abysmally – bad at forecasting over decades; or does there seem to be a purposeful “guide lower –> surprise higher” sequence (we ask rhetorically) at work?
Twitter: @andrewunknown and @seeitmarket
Author holds no position in securities mentioned at the time of publication. Commentary provided is for educational purposes only and in no way constitutes trading or investment advice.
Charts and data courtesy of Factset and Yardeni Research/Yardeni.com. Pinball image courtesy chicagoagentmagazine.com. Green Eggs & Ham image copyright Random House/Dr. Seuss
Any opinions expressed herein are solely those of the author, and do not in any way represent the views or opinions of any other person or entity.

