“No one cares about value.”
— Milwaukee-based, 40-year veteran wealth manager
A dizzying combination of trade wars, escalating tensions in the Middle East, and domestic political gamesmanship left investors struggling for direction during the period.
While the stock market alternated between defensive and offensive leadership, the underlying focus was on mitigating perceived risks.
The approach favored large companies over small, low volatility over high, and investors sought safe havens with predictable revenue. Stock market valuations remained an afterthought, as the S&P 500 finished the quarter trading at price-to-earnings multiple of over 20x.
A spike in volatility also reflected the skittish tone during the period. The performance swings of the broad indices provided opportunities for active managers to exploit pricing inefficiencies that resulted from emotional responses driven by a short-term outlook.
Growth at What Cost?
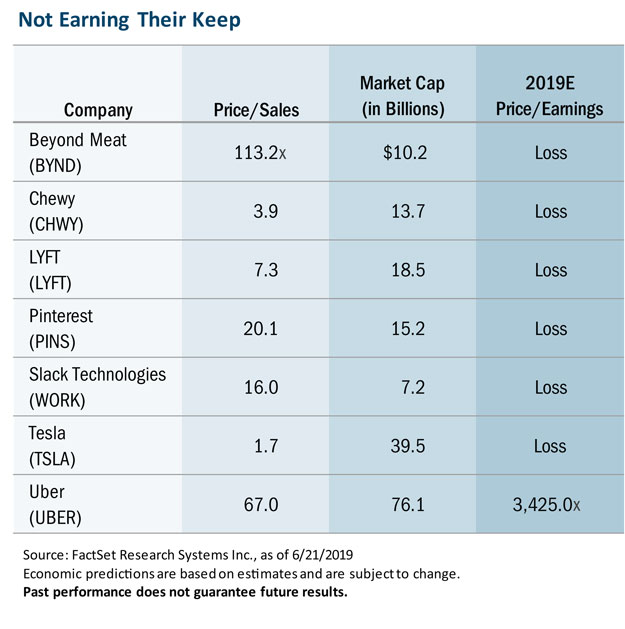
A glance at the valuations of some recent IPOs in the featured chart above confirms why our wealth manager friend declared value just doesn’t matter in today’s markets. But as long-term investors, that outlook strikes us as foolhardy.
By chasing dubious growth projections from the latest and greatest story stock, investors are setting the stage for potential pain if promised revenues fail to materialize to support sky-high multiples.
Opportunities Persist
For investors willing to look beyond daily headlines or the latest earnings releases, however, uncertainty during the first half of the year has created opportunities. During this period, we’ve sought to maintain a balanced approach rooted in valuations while also taking a clear view of the risk/reward profile of each business. As such, we aren’t making market calls, and are instead focused, as always, on capitalizing on the opportunities presented.
Our efforts have resulted in each of our strategies trading at the end of the second quarter at a discount on a price-to-earnings basis ranging from 13%to 40%compared to the S&P 500. These valuations, we believe provide a margin of safety for investors in what is an expensive market. Additionally, each of the four portfolios has a lower debt-to-capital ratio than its respective benchmark.
Looking forward, we believe it’s important to avoid jumping into positions that have only recently come under pressure, even if their valuations have improved. In our view, the prudent course is to get past a fear of missing out on upside potential and stay focused on company-specific factors.
This article is by Bill Nasgovitz, Chairman and portfolio manager.
Disclosure: Past performance does not guarantee future results.
Investing involves risk, including the potential loss of principal. There is no guarantee that a particular investment strategy will be successful. Value investments are subject to the risk that their intrinsic value may not be recognized by the broad market.
The statements and opinions expressed in this article are those of the presenter. Any discussion of investments and investment strategies represents the presenters’ views as of the date created and are subject to change without notice. The opinions expressed are for general information only and are not intended to provide specific advice or recommendations for any individual. Any forecasts may not prove to be true. Economic predictions are based on estimates and are subject to change.
As of 6/30/2019, Heartland Advisors on behalf of its clients held approximately 0.00%, 0.00%, 0.00%, 0.00%, 0.00%, 0.00%, and 0.00% of the total shares outstanding of Beyond Meat, Inc., Chewy, Inc., Lyft, Inc., Pinterest Inc., Slack Technologies Inc., Tesla, Inc., and Uber Technologies, Inc., respectively. Statements regarding securities are not recommendations to buy or sell. Portfolio holdings are subject to change. Current and future holdings are subject to risk.
Definitions: Active Management: the use of a human element, such as a single manager, co-managers or a team of managers, to actively manage a fund’s portfolio. Active managers rely on analytical research, forecasts, and their own judgment and experience in making investment decisions on what securities to buy, hold and sell. Price/Earnings Ratio: of a stock is calculated by dividing the current price of the stock by its trailing or its forward 12 months’ earnings per share. Price/Sales Ratio: is calculated by dividing a stock’s current price by its revenue per share for the trailing 12 months. Total Debt/Total Capital Ratio: of a stock is calculated by dividing the short- and long-term debt obligations of the company by its total capital, which is represented by the company’s debt and shareholders’ equity, which includes common stock, preferred stock, minority interest and net debt. S&P 500 Index: is an index of 500 U.S. stocks chosen for market size, liquidity and industry group representation and is a widely used U.S. equity benchmark. All indices are unmanaged. It is not possible to invest directly in an index.
Any opinions expressed herein are solely those of the authors, and do not in any way represent the views or opinions of any other person or entity.


