News & Highlights of What I Cover In This Article:
– Federal Reserve Boosts Liquidity To Support Economy
– Consumers Are Unsettled About Current Situation
– Corporate Earnings Rebound May Lag Expectations
– Investor Sentiment Indicators Are Mixed
– Small-Caps May Lead Heading Toward Election
– Rally Participation Improving
Every area of the world has experience with natural disasters – for many, hurricanes, earthquakes and tornadoes are all too frequent events. Sometimes preparations can be made well in advance, other times the storm emerges more abruptly, with little or no warning. When it does come, we have little choice but to find safe spots, hunker down, and ride it out.
Every area of the world has experience with natural disasters – for many, hurricanes, earthquakes and tornadoes are all too frequent events. Sometimes preparations can be made well in advance, other times the storm emerges more abruptly, with little or no warning. When it does come, we have little choice but to find safe spots, hunker down, and ride it out.
From the relative safety of an inside room or storm cellar we wait for the wind to die down and the earth to stop trembling. Not knowing whether it is a lull or an all-clear, the first steps out of our shelter can be tentative and uneven. The storm’s passing can be greeted with mourning at the damage that has been caused and concern about what still may be in store, but also relief at having gotten through it.
As confidence that the worst of the disaster has passed, clean-up and rebuilding efforts begin in earnest. This path forward is rocky and uneven – filled with debris. Eventually progress overwhelms setbacks and in time, the community figures out its new normal.
We are moving away from coronavirus lockdowns and again venturing down paths that were once routine but are now seen in a new light. In doing so, there are chances to assess the damage done even as evidence of returning growth is celebrated.
It is well advertised that the financial markets move ahead of the economy and that expectations can outpace reality – on the upside as well as the downside. While so much about the current environment is unprecedented in its particulars, we can still listen to the patterns of history and rely on indicators that have been useful in the past.
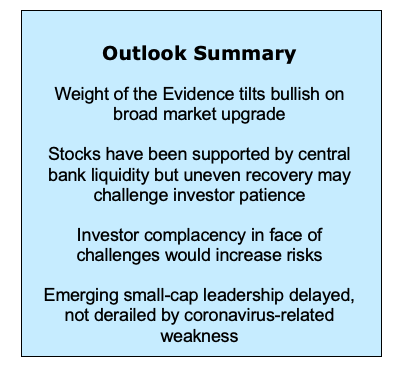
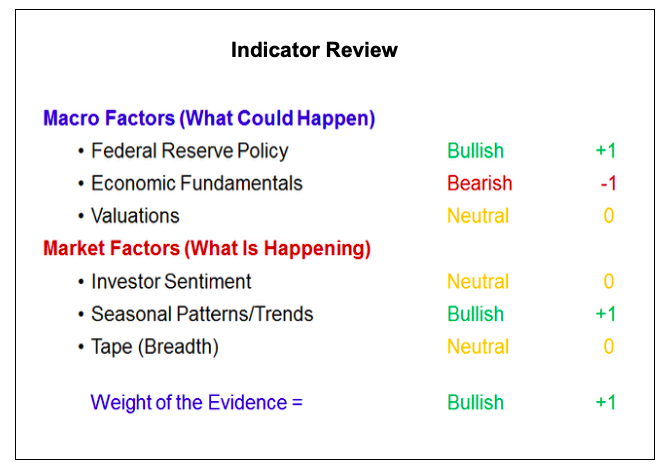
The future is always uncertain and trying to forecast it is a fool’s errand. By considering the weight of the evidence, we can lean toward opportunity and away from risk. Right now, the evidence has turned more favorable – the stock market has trusted the support provided by the Federal Reserve and has rallied ahead of economic improvement. While prices have turned higher, earnings expectations have collapsed. This has pushed forward-looking valuations to levels not seen in years. Investor sentiment is mixed.
Rally participation has been less than robust, but it is improving. Broad participation in the US and around the world, coupled with leadership from small-caps and cyclical sectors, would be encouraging evidence that the storm has indeed passed and the economy is on the path to recovery.
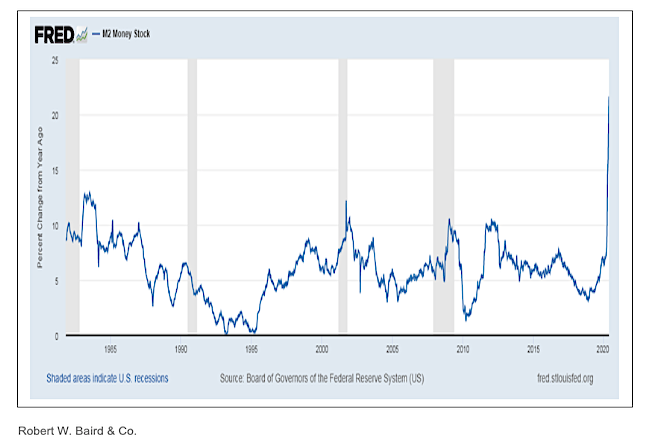
Federal Reserve Policy is bullish. Fed Chair Powell has been clear that the Fed can and will help address problems of liquidity but it cannot deal with issues of solvency. Time can turn liquidity problems into solvency problems. Under Powell’s leadership the focus of the Fed has not just been on the intensity of growth but the duration of growth.
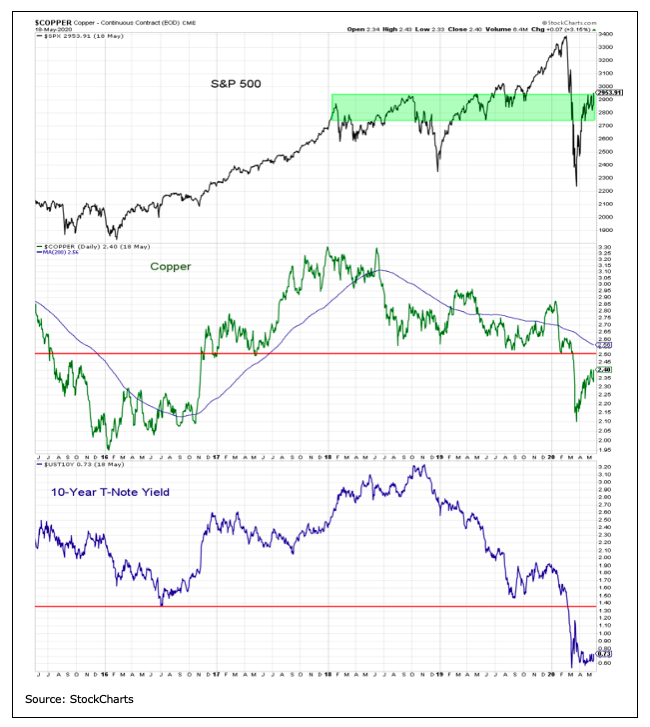
In the same way, the Fed is using its lending authorities to boost liquidity and help limit the duration of the current economic weakness. This prevents near-term problems compounding into longer-term problems. Rising Treasury yields and copper prices would be evidence that the Fed’s liquidity operations are having a meaningful effect beyond just buoying stock prices.
Economic Fundamentals remain bearish. The abruptness of the economic weakness has rendered many (if not most) charts of economic data unreadable. But while there is so much about the current environment that is unprecedented (even the use of that word) it can be comforting to know that some things are still following more normal patterns. One such example is the relationship between the view of current conditions (present situation) and the future (expectations).
The collapse in the confidence spread between the present situation and expectations is entirely consistent with the experience of past recessions. Increased confidence in the present would be evidence that economic conditions have stabilized. The latest update to the NY Fed’s weekly economic index suggests that is not yet occurring.
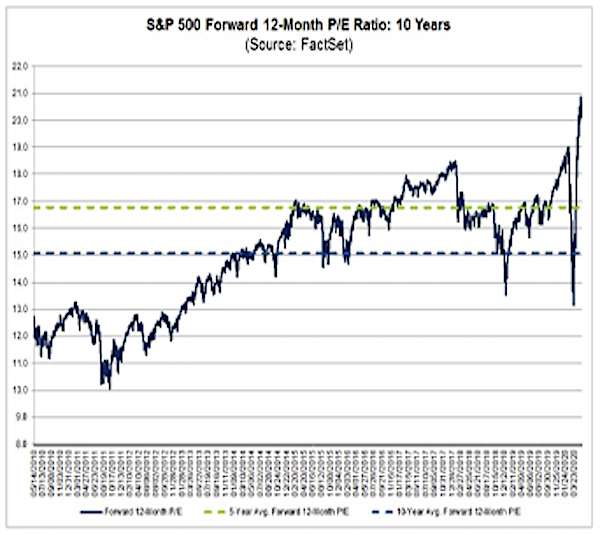
We continue to see valuations as neutral even though P/E ratios based on forward earnings have risen to their highest levels in years (after dropping to the lowest level in yers). Rather than dwell on the near-term volatility of both prices and earnings estimates (and the relationship between the two), a better exercise might be to consider the historical path for earnings coming out of recessions. The current consensus calls for relatively swift recovery in profits, but even if economic growth starts to improve later this year, history suggests the recovery in earnings is likely to be an uneven and drawn-out affair.
Sentiment is mixed and we can see evidence of both optimism and pessimism, complacency and fear. This mixed message is present both in what investors are doing (via flows and portfolio positioning) and what they are saying (via sentiment surveys).
The latest data on equity fund flows shows dollars flowing away from equities. Stocks tend to do well in the face of this sort of skepticism. But for all the weekly datapoints showing equity fund outflows and rising money market assets, aggregate exposure data shows that as of the end of March equity levels were still above their long-term average and cash levels were still below their long-term averages. More recently, options data is showing the sort of complacency that was present in the first half of February.
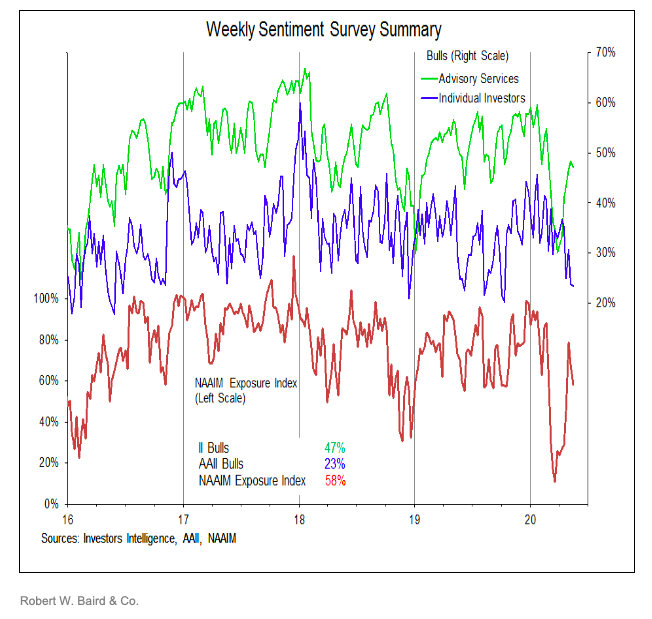
Sentiment survey responses are similarly mixed. Over the past six weeks, those surveyed by Investors Intelligence (advisory services) and NAAIM (active investment managers) have turned more optimistic. Bulls on the II survey have risen from 30% to 47% (bears have dropped from 42% to 26%) and the NAAIM exposure index surged from 11% to 79% before retreating back to 58% most recently). Individual investors surveyed by the AAII have responded differently. Bulls on that survey are at 23% (a new cycle low, but above where they were as recently as October) and bears have soared above 50%, their highest level in years.
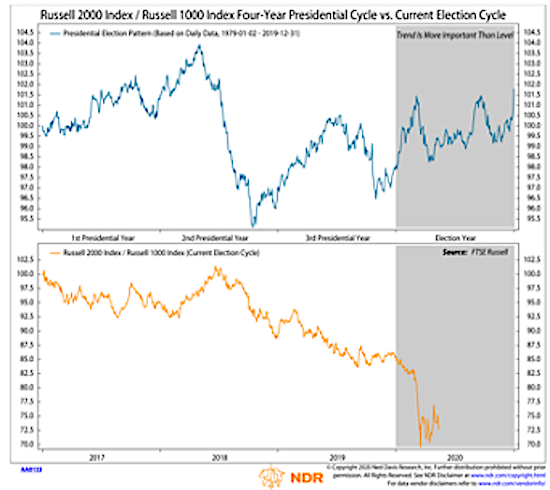
Seasonal Patterns & Trends remain bullish. While strict enforcers of calendar-related dictums would have investors selling in May and going away, this adage is widely enough quoted to be of little use. Two other trends may be of more use to investors in the current cycle. From the perspective of stocks overall, the market tends to rally into elections when incumbents get re-elected and struggle heading into elections when they are defeated. There is little evidence in the latest Gallup polling to suggest an incumbent defeat in November.
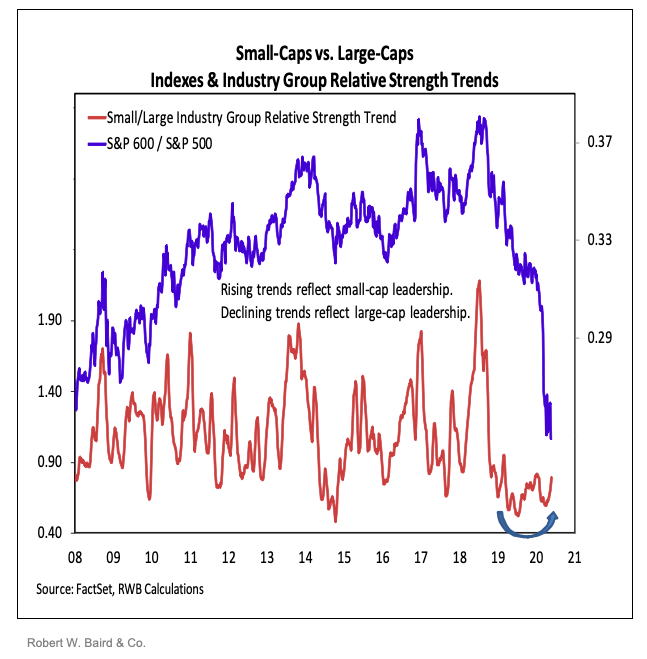
From a size perspective (and independent of election outcome), small-caps tend to rally versus large caps over the course of election years. While the coronavirus outbreak has had an acute effect on small-caps, we are seeing evidence of improvement consistent with historical patterns.
Breadth has been upgraded to neutral. For most of the rally off of the March lows, a recurring message was narrow participation, with just a handful of stocks driving the market higher. More recently, however, we have seen evidence of increasingly broad participation. Nearly 80% of the industry groups in the S&P 1500 have 10-week averages that are rising and 96% are currently trading above their 10-week averages (the highest level in over a year). Looking around the world, more than 80% of markets are trading above their 50-day averages.
While breadth indicators are improving, they are not without blemishes. Our sector-level trend model is less than robust and the percentage of stocks and global indexes above their 200-day averages remains subdued. Breadth thrust indicators based in stocks at new 20-day highs and the percentage above their 50-day averages have not yet fired.
What To Do Now?
Investing has been a bit of a roller coaster ride in 2020, with an epic decline followed by an epic rebound. If the volatility of the past several months has been too uncomfortable, now may be a good time to reconsider your risk tolerances and tweak your financial plan.
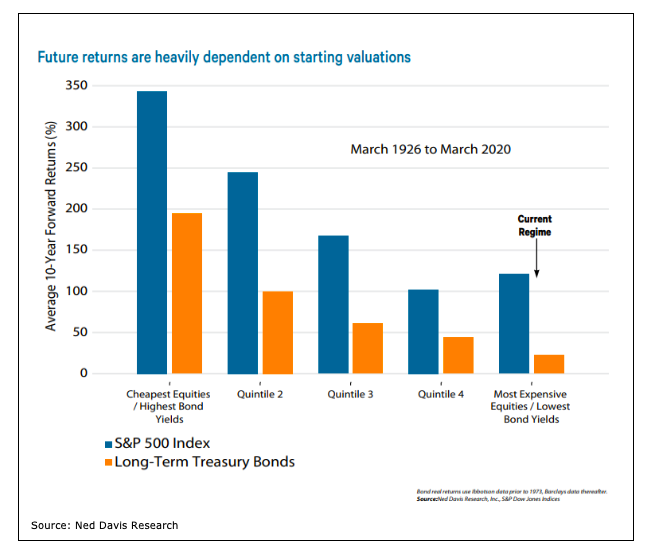
Given the long-term headwinds to future returns based on current valuations, a strategically sound plan may call for tactically dynamic asset allocation. Rules-based tilts can increase equity exposure when the risk environment is favorable and decrease it when the backdrop is more challenging. Our weight of the evidence approach provides such guidance, and with it turning positive, investors can consider opportunities to tactically increase equity exposure.
The best opportunity now may be tilting toward mid-caps and small-caps. Recent breadth improvements suggest the average stock may start to play catch-up versus the pace-setters. Despite the rebound in the index, the median stock in the S&P 500 is 23% below its 52-week high and the median stock in the S&P 600 is still nearly 40% below its peak.
The stock market overall tends to see evidence of improvement prior to the economic data bottoming, and the period between the market low and the economic low tends to be characterized by small-cap leadership.
Prior to the coronavirus outbreak, small-cap groups were seeing improving trends versus large-caps. That turn was delayed, but our current work suggests it was not derailed. Small-cap groups are again seeing improving trends versus large-cap groups even as small-cap indexes are at nearly two-decade lows versus large-caps.
Twitter: @WillieDelwiche
Any opinions expressed herein are solely those of the author, and do not in any way represent the views or opinions of any other person or entity.


