The month of September ended with a thud as the S&P 500 Index closed at new lows.
And several sectors are now trading at critical price support. One of those sectors is the Financial Sector (XLF).
It doesn’t take much thought to realize that the financial sector is one of the most important (and telling) sectors for both the economy and stock market. And today’s chart shows why active investors should tune into trading on the XLF.
As usual, I share a simple (yet important) chart with high level takeaways.
Note that the following MarketSmith charts are built with Investors Business Daily’s product suite.
I am an Investors Business Daily (IBD) partner and promote the use of their products. The entire platform offers a good mix of analysts, education, and technical and fundamental data.
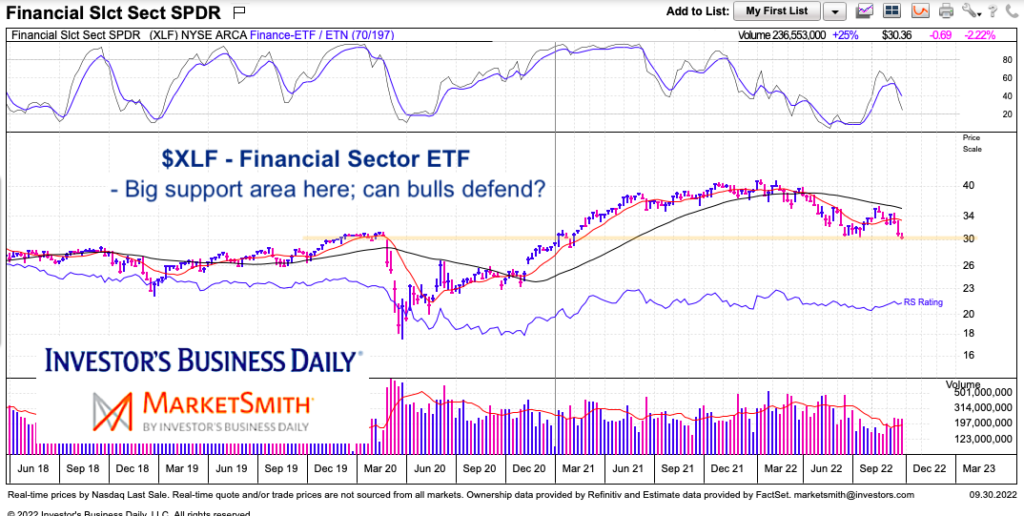
$XLF Financial Sector ETF “weekly” Chart
The Financial Sector (XLF) is revisiting its summer low. This support is even more important in that it was prior resistance for the early 2020 high (pre-covid) as well as early 2021 resistance before breaking out. What XLF does here will be important. A bounce will likely correlate to a bounce in the stock market indices. A breakdown will likely lead to new lows for the stock market indices. Only a breakout above its 200-day moving average would suggest a bigger move and perhaps trend change for the indices.

Twitter: @andrewnyquist
The author may have a position in mentioned securities at the time of publication. Any opinions expressed herein are solely those of the author, and do not in any way represent the views or opinions of any other person or entity.


