Today the market news was all about Janet Yellen and the Federal Reserve hiking rates. At 2:00 PM EST, Federal Open Market Committee did not surprise by unanimously voting to raise the range of the federal funds rate to 0.50% and 0.75%. Economic data has been strong as of late, inflation measures have been rising (along with the stock market), and therefore this was very much expected.
And because of this (perhaps), investors sold the news. The broad based indices gave back gains and performance was weaker in afternoon trading.
The Federal Reserve’s expectation for short term GDP growth increased to 2.1% for 2017, while forecasts for the unemployment rate remained predominately static, with officials expecting the rate to fall to 4.5% by 2019. The Fed officials projections showed the federal funds rate increasing in 2017, indicating three quarter point raises for the year.
Instead of showing the played out dot plot chart, I think it is more useful to take a look at what moved in the markets today (indices, asset classes, sectors, and stocks).
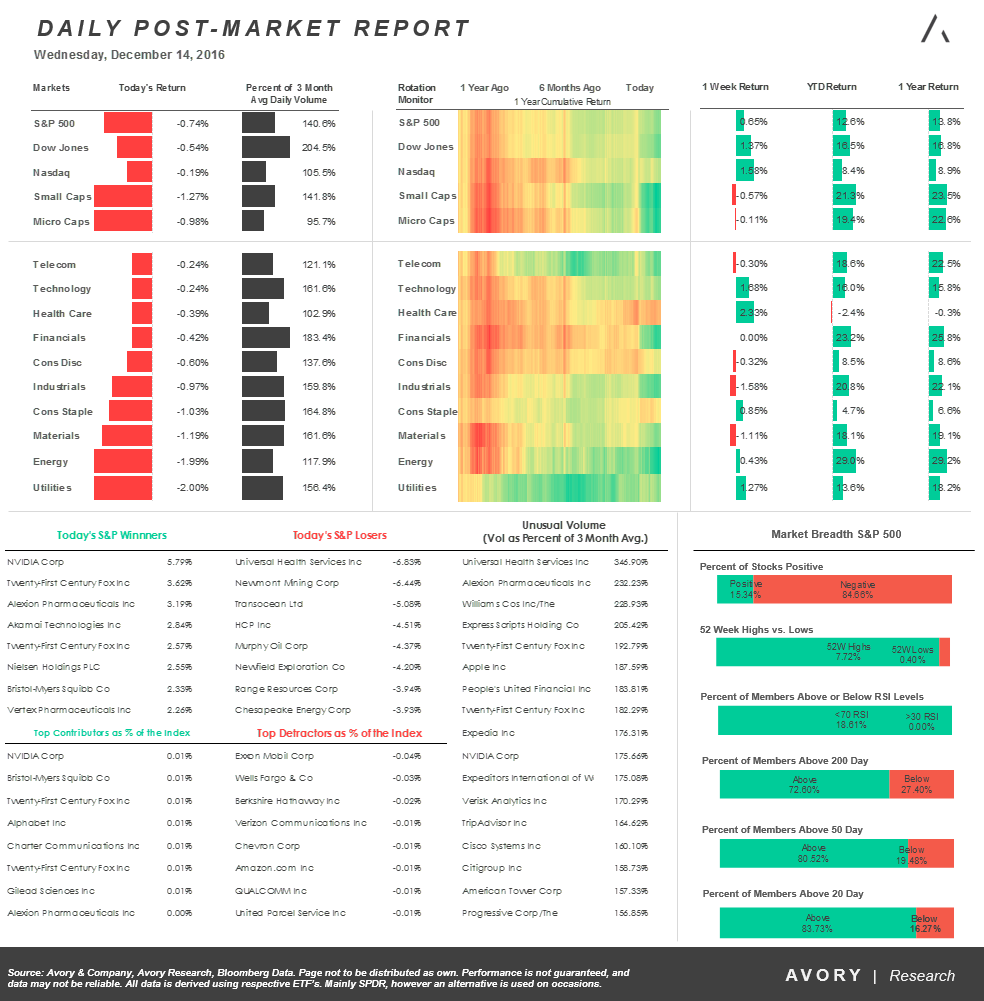
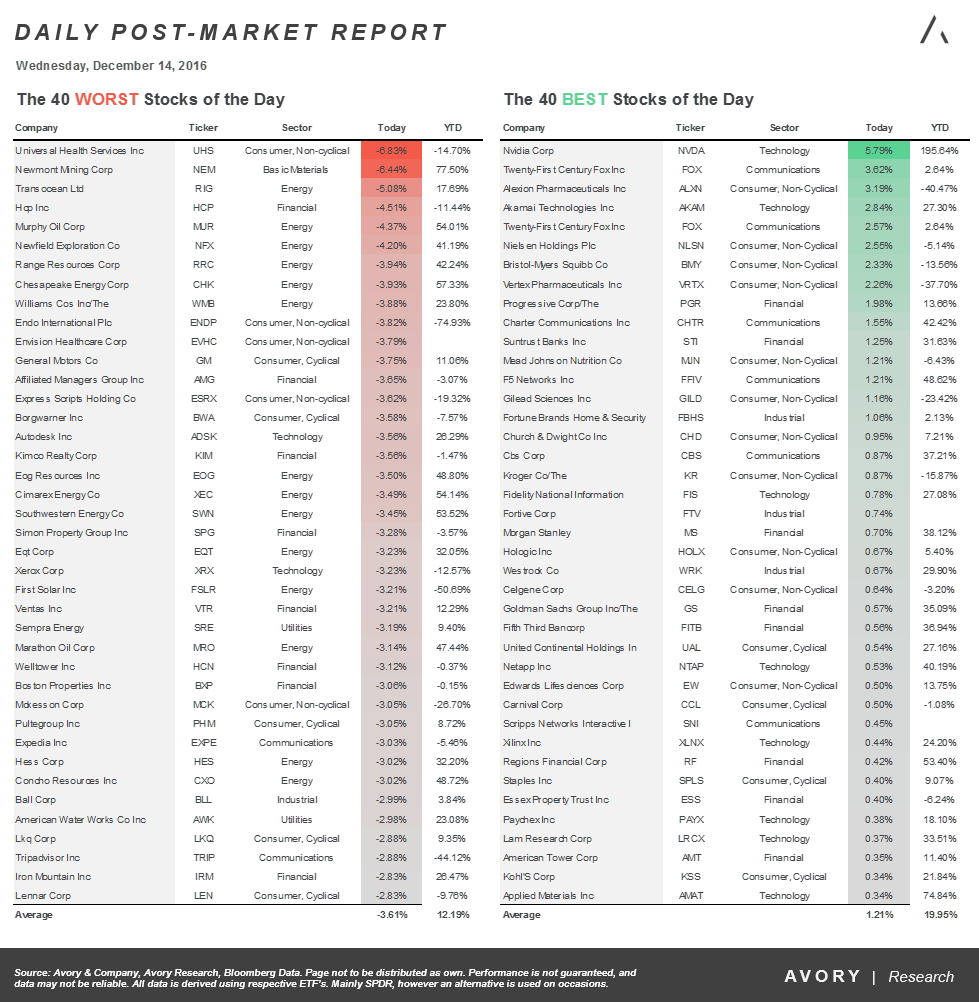
Below are two tables, the first showing today’s market moves, and the second showing the best performing stocks and worst performing stocks in the S&P 500 (NYSEARCA:SPY) on the day.
Quick takeaways:
- Equities and fixed income were down on the day.
- Small caps (NYSEARCA:IWM) and Micro caps were hit hardest. These have performed well lately.
- Utilities (NYSEARCA:XLU), Energy (NYSEARCA:XLE), and Materials (NYSEARCA:XLB) were hit hard, while Technology and Telecom were roughly flat.
- 84% of stocks finished lower on high volume.
- Nearly 70% of stocks are above their 200 day moving averages.
You can catch more of my market insights on my site, the Market Meter. Thanks for reading.
Twitter: @_SeanDavid
Any opinions expressed herein are solely those of the author, and do not in any way represent the views or opinions of any other person or entity.


