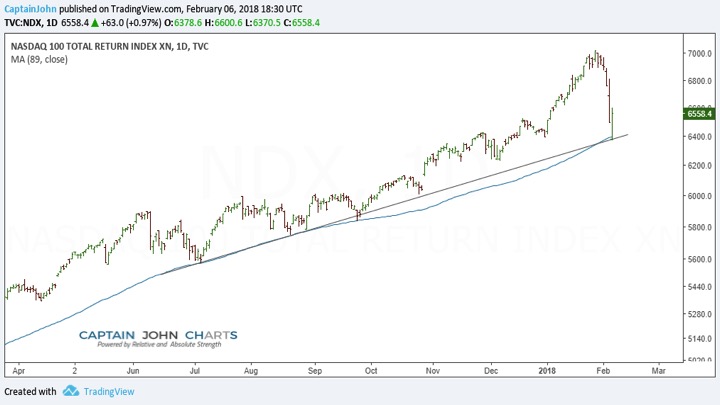
The latest stock market decline into Tuesday morning carried the Nasdaq 100 Index down to technical price support.
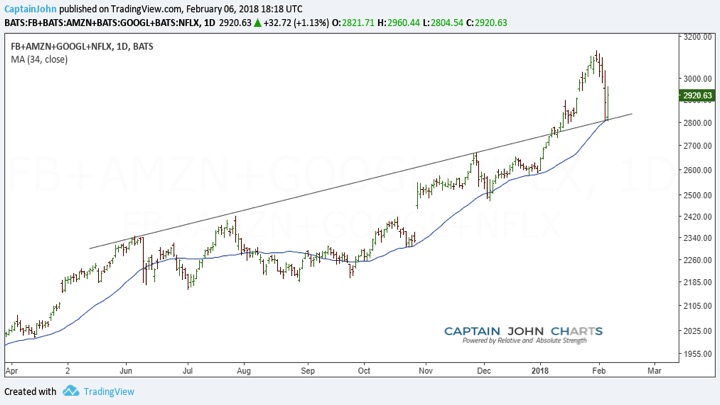
And we saw a mirror image on the composite “FANG” stocks chart (adding together Facebook $FB Amazon $AMZN Netflix $NFLX Google $GOOGL).
Looking at the charts below, you can see how price jumped off this support level. Below is a list of observations for both the FANG Composite chart and the Nasdaq 100 chart:
Nasdaq 100
Nasdaq 100 Pulled back to support from last summer and is now bouncing higher.
89 day moving average provided support, (Fib #)
FANG Composite – Facebook, Amazon, Netflix, and Google Stocks
FANG broke through resistance then pulled back and to test the breakout. They’re bouncing now!
34 day moving average ties in! (Fib #)
If you are interested in learning more about our investing approach and financial services, visit us at CaptainJohnCharts.
Twitter: @CptJohnCharts & @FortunaEquitis
The author may have a position in mentioned securities at the time of publication. Any opinions expressed herein are solely those of the author, and do not in any way represent the views or opinions of any other person or entity.


