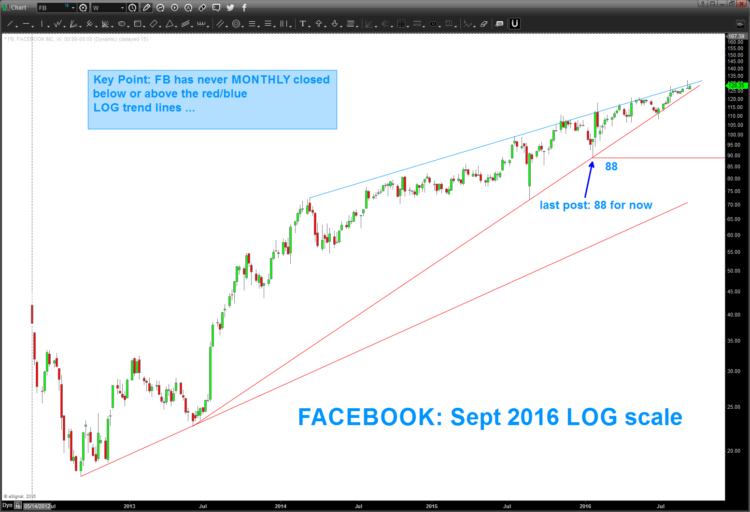
Facebook stock price has been sitting between $122-$132 since breaking to new highs in July. At it’s current price, Facebook (NASDAQ:FB) is also sitting inside a tightening wedge on it’s long-term log scale chart. And this should open the stock up to a big move before year end.
But more on that in a minute.
In my last post concerning Facebook stock (FB), we showed how upper trading price targets (at that time) were being hit and to “step aside” until the stock corrected down into the 88 area. The stock did correct as I hypothesized, but it also found that level to be support on the long term log trend line. That level has worked multiple times to help shares of Facebook continue their advance. See the “monthly” log scale bar chart below.
Some things to consider:
- Keep track of the long term LOG trend line that has it’s beginning in/around July 2013. Thus far, it has acted like a magnet and price has corrected down to it and then taken off a few times. Note, the last touch broke thru on a daily and weekly basis but it has yet to ever close below this trend line.
- Conversely, the upper blue LOG trend line has held Facebook’s stock price at bay to the upside. Note, it has never closed (monthly basis) above the upper blue LOG trend line.
- With these two lines converging, it’s highly probable that a move out of these areas is coming. I would try to avoid getting caught up in the daily noise. Probably best to stay patient and wait for a MONTHLY Signal Reversal Candle before playing FB’s next move.
Facebook (FB) Log Scale “Monthly” Bar Chart
Thanks for reading.
Twitter: @BartsCharts
Author does not have a position in mentioned securities at the time of publication. Any opinions expressed herein are solely those of the author, and do not in any way represent the views or opinions of any other person or entity.


