F5 Network (FFIV) reported earnings after the bell on Monday.
FFIV reported non-GAAP EPS of $2.18, which beat consensus estimates of $2.03.
F5 Network reported revenue of $583M, which also beat consensus estimates of $572M.
The company expects Q4 EPS to be $2.30 – $2.42 on revenue of $595M – $615M.
Consensus estimates were for Q4 EPS of $2.26 on revenue of $598.2M.
This morning, Credit Suisse and Needham raised their price targets on the stock. In spite of all this positive news, the stock is down almost 8% on the day.
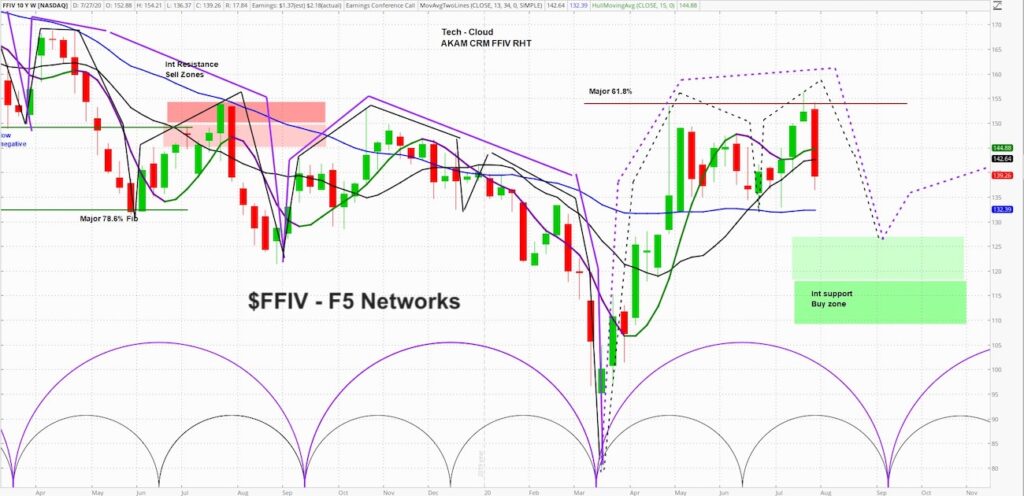
Let’s review our weekly cycle analysis for F5 Networks stock (FFIV)
F5 Network (FFIV) Weekly Chart

At askSlim we use technical analysis to evaluate price charts of stocks, futures, and ETF’s. We use a combination of cycle, trend and momentum chart studies, on multiple timeframes, to present a “sum of the evidence” directional outlook in time and price.
askSlim Technical Briefing:
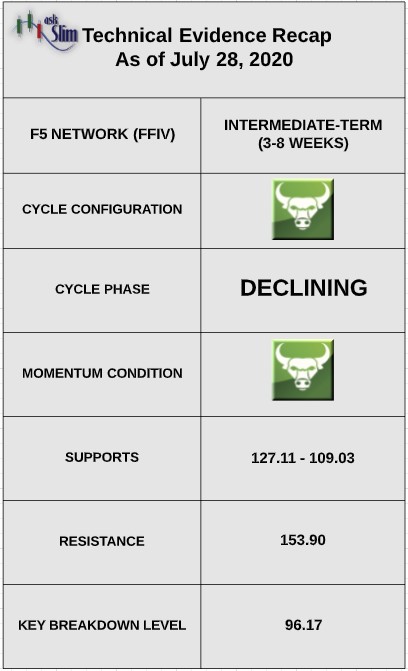
The weekly cycle analysis suggests that the stock is entering a declining phase. The next intermediate-term low is due between mid-August and early October.

On the upside, there is a major Fibonacci resistance at 153.90.
On the downside, there are intermediate-term Fibonacci supports from 127.11 – 109.03.
For the bears to gain control of the intermediate-term, we would need to see a close below 96.17.
askSlim Sum of the Evidence:
FFIV is likely entering a declining phase. Given the positive overall cycle configuration – we see a likelihood that the stock tests 127 by October before entering a more favorable period.
Interested in askSlim?
Get professional grade technical analysis, trader education and trade planning tools at askSlim.com. Write to matt@askslim.com and mention See It Market in your email for special askSlim membership trial offers!
Twitter: @askslim
Any opinions expressed herein are solely those of the author, and do not in any way represent the views or opinions of any other person or entity.


