 The resurgent US Dollar Index (futures symbol: DX) pushed to nearly 3 year highs this morning in the wake of better-than-expected consumer sentiment data, prolonging its weekly-long drubbing of the Euro even as it traded higher in tandem with stocks. On last check, the EURUSD trades at 1.2818, off 1.3% from last Friday’s closing print at 1.2989.
Last week we took a brief look at where the EURUSD has been and where it may yet go as the Eurozone continues to grapple with its currency/monetary policy/fiscal/core v. periphery/employment/referendum existential crisis, with specific emphasis on the Head & Shoulders top that dominates every short and medium-term vantage point of the pair. Marginally urgent then, the decline EURUSD has suffered since has brought it to a major technical waypoint at the H&S top’s neckline. As we’re about to see, the way down isn’t without obstacles of its own; but if this neckline breaks the implications for the single currency are dire.
Before looking at the wider sweep of its possible H&S Top, though, let’s review some closer-angle, complementary views of the pair.
EURUSD – Daily: Double Top
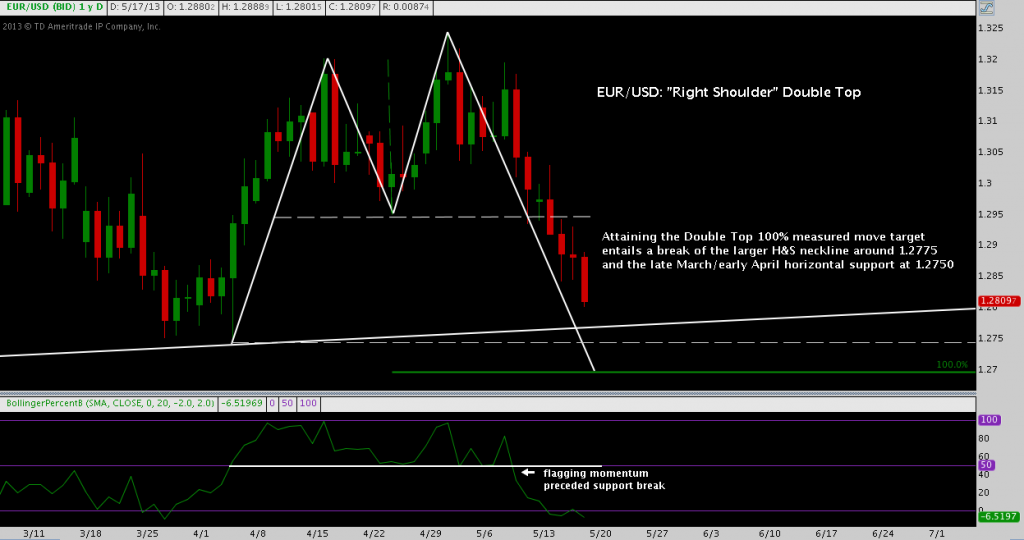
The right shoulder of the H&S Top we’re considering is actually comprised of its own, distinctive pattern: the double top. After falling heavily from near 1.32 EURUSD came to rest again just above 1.2950 (see 1.2954 04/24/13 support denoted by dashed grey horizontal line) late last week. Euro buyers came off the fence there late Friday to close the pair at 1.2989; but Sunday/Monday saw the pair trade back down to 1.2950, this time producing a less enthusiastic long-side response by installing a green doji (click image to zoom):
Tuesday traded up nicely in the early going to peak at almost 1.3050; but aggressive selling then took over and with it 1.2950 gave way and the double top below was activated. In this instance, %B (bottom panel above) issued an early signal, breaking the momentum support shelf at 50 that coincided with 1.2950 support a couple sessions before price itself broke. Since Tuesday’s close, Euro bears have shown little sign of letting up, with the pair now more than half-way to its 1.27 target some 250 pips below the pattern’s breakout level.
As I just mentioned, the double top in EURUSD is a short passage in a longer technical movement that is the right shoulder of the still greater piece playing here: the Head & Shoulders Top. Flipping between multiple timeframes, you’ll find this phenomenon of “nested” or “telescoped” patterns is quite common. The chief benefit, in my experience, of noticing these relationships is studying how small patterns tip into larger ones. What often results is a kind of domino effect in which a smaller pattern triggers a larger pattern as it reaches its target. In ideal scenarios, that medium pattern will in turn pile into yet another pattern; and so a technical snowball effect as each pattern’s unfolding creates a new cycle in the momentum feedback loop underway. This is how small breakouts beget very long trends.
With that in mind, let’s step out to a larger pattern.
EURUSD – Daily: Measured Move Down
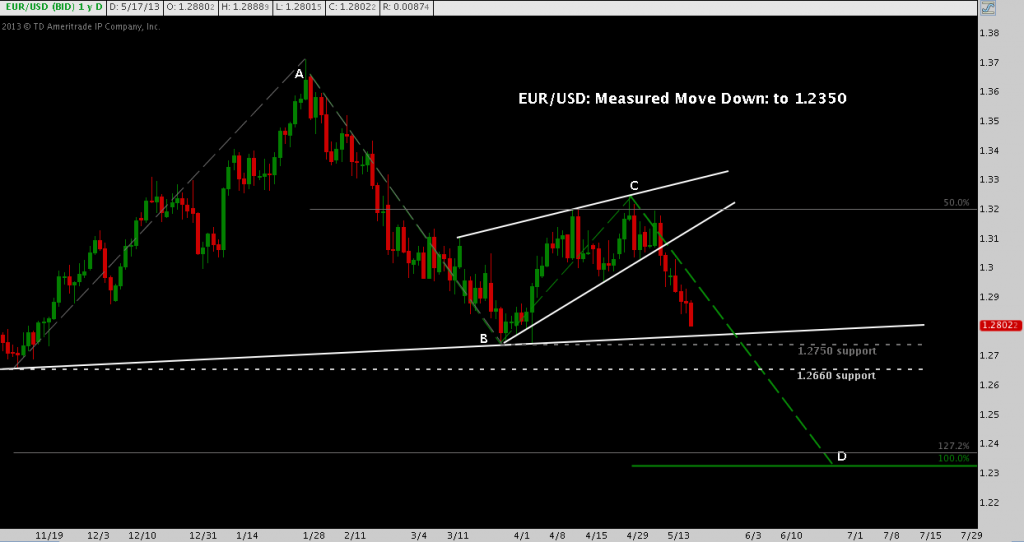
Here we’ll take an alternate view of the H&S top: one that is often overshadowed and missed by the conventional H&S view – but is often the technical explanation for why a Head & Shoulders does not reach its full target after breaking. The arch of the Double Top pattern we reviewed above is framed in the white rising wedge between B/C (click image to zoom):
In this case, the smaller double top pattern occurs inside, but actually broke out after the larger rising wedge pattern depicted here broke down through support. This break set off the 3rd and final leg of a measured move down that projects a move 450 points lower to around 1.2350 at D.
This chart gives us our first look at some of the downside obstacles EURUSD may encounter. The white diagonal line that skirts beneath B and which price is now approaching is the H&S Top neckline at 1.2775. This level occurs inside the bottom range the pair hammered out in late March/early April between 1.2750-1.28. As I mentioned in last Friday’s post: “…assuming EURUSD makes it below 1.2985 to begin with – I expect another rigorous defense of 1.2750-1.28.” That view has not changed; and indeed EURUSD made it as low as 1.2798 this AM before bidding some 20 pips higher. Some 100 pips lower another significant support level comes in at 1.2660.
EURUSD – Daily: Head & Shoulders Top (Refreshed)
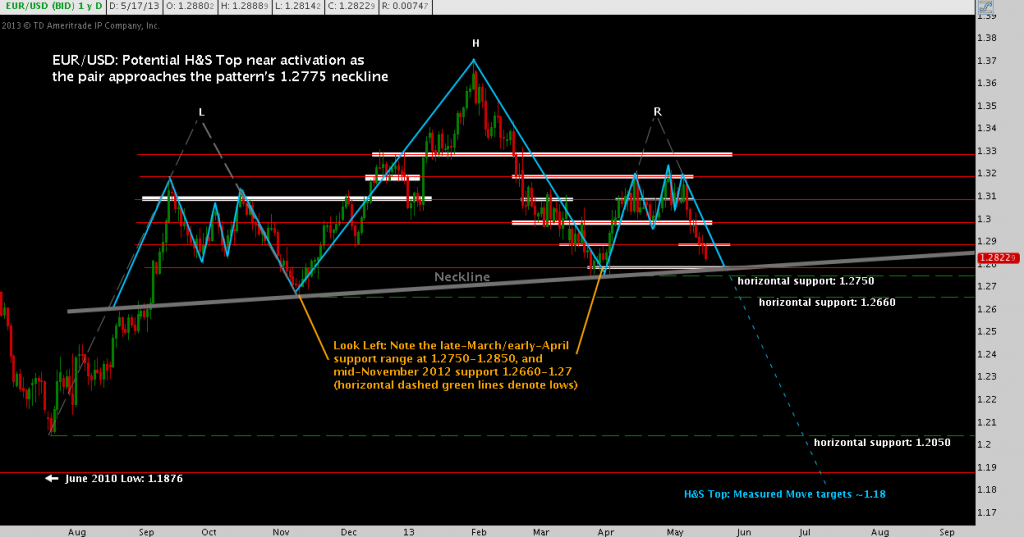
That brings us to the much spoken-of pattern (click image to zoom):
Recall that last week the Double Top had not yet broken out, with Friday closing just below 1.30. Now hovering just over 1.28, EURUSD hasn’t dropped significantly in nominal terms; but it has moved down just enough to place it in pivotal territory.
Even though a substantial decline is just behind us, on this timeframe technicals are just now signaling to sit up and take note: a big move one way or another is about to occur. At the current intersection of time and price, the H&S Top neckline sits at 1.2775. Should the pattern plays out exactly to type, a break below this level suggests a 1000 pip drop (dashed blue line) to roughly 1.18.
1000 pips? 1.18 – really? That could sound a little far-fetched: until you consider a comparable move occurred off the late January high at 1.3710.
That’s not the end of the story: I’d be remiss if I didn’t mention all the stumbling blocks lying in wait to trip up EURUSD’s race downhill. The most significant one has already been mentioned: the loose cluster of neckline and horizontal support between 1.2660 (see the chart note in yellow for more detail) and 1.28 stands as the major area of demand. While it’s by no means certain, it is reasonable to expect sustained interest in Euros in this area.
If the USD rams through this level (expect S&P 500 at 1700 if this occurs while the current positive SPX-to-USD correlation is sustained, by the way), there are other levels beneath:
- 1.25 is a minor foothold from Aug/Sep 2012;
- Measured move down and July/Aug 2012 support come together at 1.2350-1.24.
- Major horizontal support and Inverse H&S Bottom Support from July 2012 at 1.2050-1.2150
- Finally, the June 2010 “QE1-coming-t0-and-end” low at 1.1876.
The way down is fraught with challenges for USD bulls. If that’s so: what about the way up? Is there a way up?
It’s important enough to reiterate: 1.2660-1.28 will probably be well-defended: i.e., well-fortified with a deep book of contingent buy limits contingent on technical criteria. Just meeting this level today, it’s impossible to say what a plausible bounce scenario from it would look like.
Fortunately, we don’t have to know. Instead (and if there’s one practical takeaway here, it’s this), just mark your chart with this buffer zone, and pay attention to how price acts against and reacts to it for clues on whether or a bounce or breakdown is next. Of course zones like this can be messy, congestion-ridden affairs – they don’t possess the imaginary tidiness of lines – and this one will probably be no exception, however it resolves. If we don’t see a clean reversal or continuation right away in EURUSD from 1.2660-1.28, treat the consolidation as the opportunity it is: a well-delineated price range with specific breakout levels around which we can effectively risk-manage the break, whichever way it goes.
Twitter: @andrewunknown and @seeitmarket
Author is net short EURUSD through combination of spot forex and currency futures at the time of publication
Any opinions expressed herein are solely those of the author, and do not in any way represent the views or opinions of any other person or entity.


