 Previous articles in this series have encompassed some of the key themes with regard to the Equity Risk Premium (ERP). In this instalment I propose to examine some of these using UK data from Thomson Datastream and other sources. After an introduction to the indices used, we will look at Equity Risk Premium historical data in the UK since the mid-1970s and compare that with the common assumption of a 6% ERP worldwide. We will also consider how the premium is calculated, using arithmetic or geometric means, and also give some thought to what is a risk-free asset. To begin, we will examine the sources of the data before digging into the Equity Risk Premium historical data.
Introduction to Indices Used
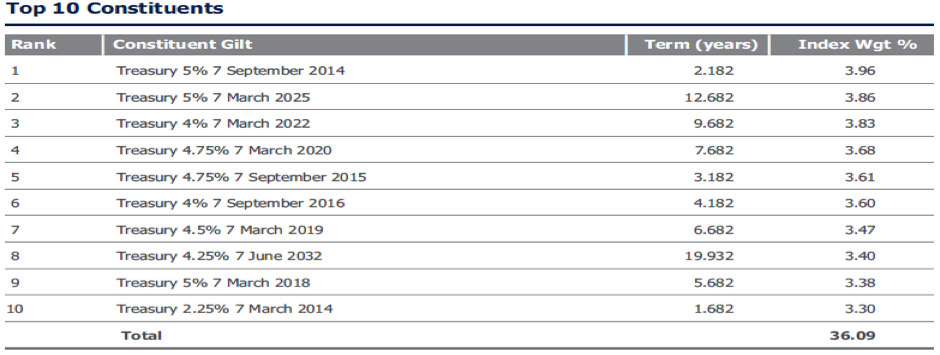
Dimson et al (2002) explained that it was fundamental to use total returns when measuring long-term performance. This means we include dividends when looking at the equity returns as (p.35) “omitting dividends from stock returns imparts a huge cumulative downward bias.” Similarly, we must include the capital element of a Gilt return (p.35) “as returns simply from promised yields would frequently have overstated achieved returns since bond investors have often been disappointed, and experienced capital losses”. This has been important in my consideration of the data to use in this section of the paper and accordingly, my calculations on the following pages are based of the FTSE All Share Index (for equities) and the FTSE Actuaries UK Conventional Gilts. FTSE.com describes the All Share Index as representing “the performance of all eligible companies listed on the London Stock Exchange’s (LSE) main market, which pass screening for size and liquidity. The index captures 98% of the UK’s market capitalisation.” As a consequence, it is “considered to be the best performance measure of the London equity market”. With regard to Gilts, the index used “comprises gilts with all outstanding terms.” This is illustrated by an example of its current composition below. Click images to enlarge.
Figure 1: Conventional Gilts Index Constituents (Source: www.ftse.com)
FTSE.com describes this index as containing “Securities with all outstanding terms from the Conventional index family of the FTSE Actuaries UK Gilts Index Series, which includes all British Government Securities quoted on the London Stock Exchange.” This data is available from 1976, thereby constraining the period over which I may calculate the Equity Risk Premium historical data. With regard to both indices, only total returns are being considered, unless otherwise stated and this data will be the source of the following ERP calculations.
Calculating and Getting at Equity Risk Premium Historical Data
Most studies have tended to focus on the US; it is my intention to examine the UK, from 1976 to 2012, the starting date fixed by the availability of DataStream’s information on UK equities and gilts. Since the financial crisis of 2008, the rates on risk free assets have reached exceptionally low levels. In the UK, the Quantitative Easing policy has pushed down yields on Gilts, often making them negative on an inflation-adjusted basis. This situation is unlikely to be reversed in the near-term as there is a world-wide shortage of “safe-haven” assets. What are the implications for ERP? When we look at our data from the FTSE All Share for 2011, gilts outperformed equities (on a real monthly returns basis) on seven occasions, as can be seen in Figure 2. It is clear to see that the third quarter was poor for equities, reflecting the impact of the July EU Summit and the fears of sovereign default and contagion.
Figure 2: ERP 2011
On a real annual total return basis for 2011, equities were -7.89% and gilts were 10.25%; their strongest performance since 2009. This isn’t such a surprising result given the Bank of England’s quantitative easing policy and the inverse relationship between yield and gilt price. Certainly the yields would be suppressed but this is more than balanced by the price appreciation which forms the basis of the high return. Given these recent developments, it makes us more aware that it is difficult to talk about, and calculate an Equity Risk Premium historical data. Arnott (2011) raises this point so it is imperative that we look at the risk premium over a longer period.
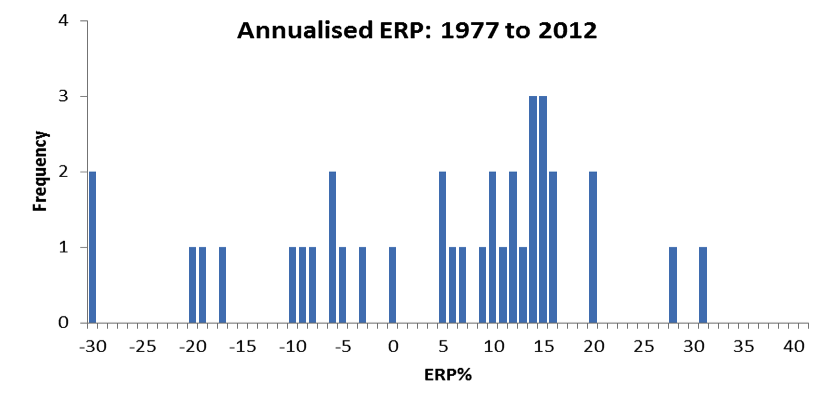
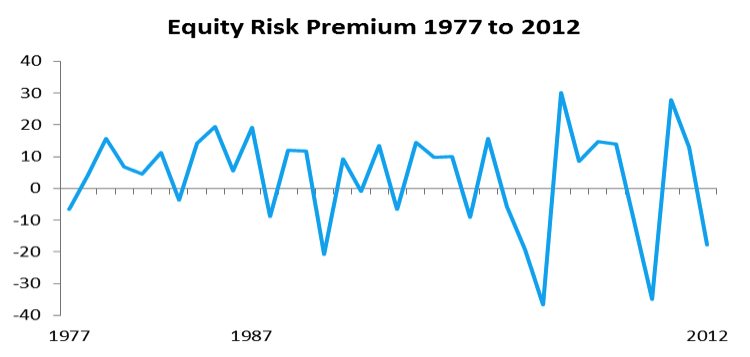
Before doing so, we must examine the Equity Risk Premium over the period that concerns us, 1976 to 2012. Figure 3 illustrates this:
Figure 3: ERP 1977 to 2012
These Equity Risk Premium historical data points have been calculated after taking inflation into account and are based on annual returns. It is worth noting that over this time period the distribution is not symmetrical, and could not be described as a normal distribution. This contrasts with Dimson et al (2002) whose year-by-year US data was roughly symmetrical, given their longer time period.
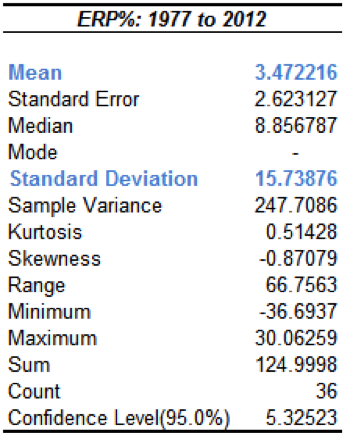
Figure 4 (at left): Descriptive Statistics 1977 to 2012
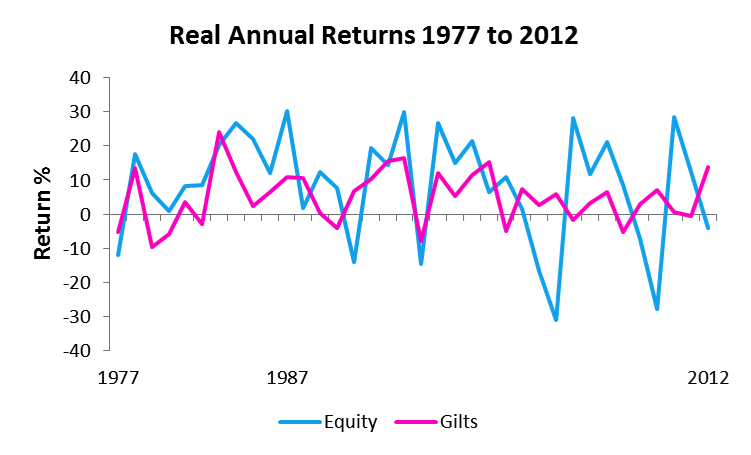
The average premium is 3.4722%%, with a standard deviation of 15.7388%. This is similar to Vivian’s (2007) assertion that the late 20th Century UK Equity Risk Premium “was most likely to be in the region of 3–4%. This perhaps does not seem to be a great reward for the extra risk that equities expect of investors. We can identify some of these in the data. There are some critical moments which impact the annualised returns, such as October 1987 and August 1998. In the former the monthly premium was -31%, following on the heels of Black Monday and in the latter, the return against bonds was -13%, after the Russian Financial Crisis and the implosion of Long Term Capital Management. The ERP for 1987 and 1998 were -6.99% and -5.03% respectively. On a positive note, there have been four occasions of double-digit returns, and these, like the large negative values, were termed by Dimson et al (2002) p164 as “excess returns.” Looking at the period we are considering, 1976 to 2012, Figure 5 displays the greater volatility in total returns from equities. Over this period they have a mean of 9.2057 and standard deviation of 16.488, compared with 5.012 and 7.832 respectively for gilts. The chart starts from 1977 as we are computing annual returns and our data commences in 1976.
Figure 5: Real Annual Returns 1977 to 2012 (Appendix 2)
Following on from the data in Figure 5 we may calculate Equity Risk Premium historical data:
Figure 6: ERP 1977 to 2012
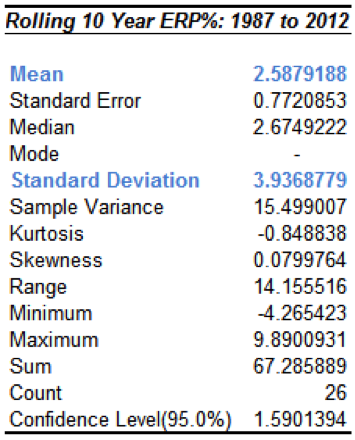
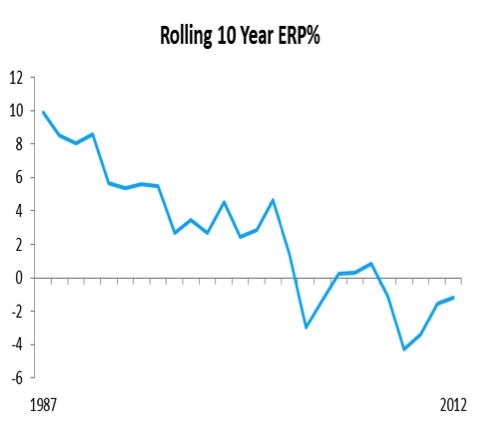
From Figure 5 we can see that equities started to diverge from bonds in the early 1980’s and this continued through the 1990’s. 2000 and 2001 saw the Dotcom Bubble burst, closely followed by the terrorist attacks on September 11 2001. In an earlier article we read Glassman’s (2006) theory that there is a discount priced into equities and this may be visible in equity performance over the last ten years. Indeed, if we look at the rolling ten year ERP, we can see that the risk premium is trending downwards, as is made clear in Figure 7, providing a contrast to Figure 6.
Figure 7: Rolling 10 Year ERP% (Appendix 3)
As we can see, the rolling ten-year mean Equity Risk Premium is 0.8843% lower than the annual mean Equity Risk Premium (Figure 4). We would expect this value to be higher than the annual ERP but we are constrained by the time period of our data. It is also worth noting though how even these returns have been impacted by the events of 2000 to 2002 and the financial crisis, emphasising the importance of timing in generating reasonable returns.
Short and Long Term Gilts and the Equity Risk Premium
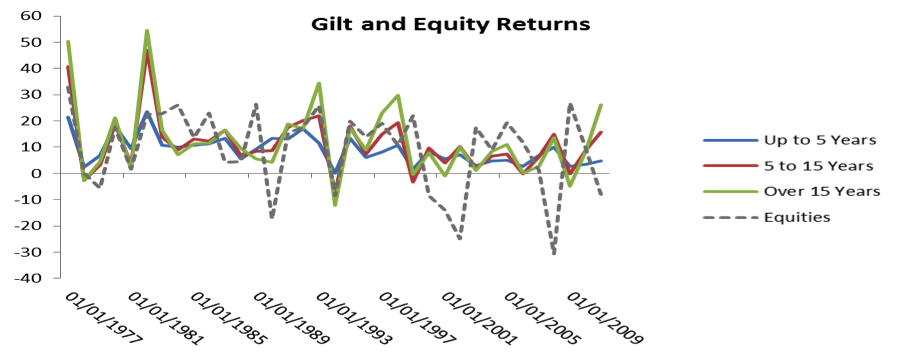
An important aspect of the ERP is what exactly is it being measured against? We will look at the gilt data we have available and thereafter compare that to other measurements which may be considered risk-free. From the data we have available for this section we can compare the ERP using gilts of three distinct durations: up to five years, five to fifteen years and over fifteen years. As a starting point, it is worthwhile to compare the returns on these gilts against equities on the FTSE All Share:
Figure 8: Gilt and Equity Returns
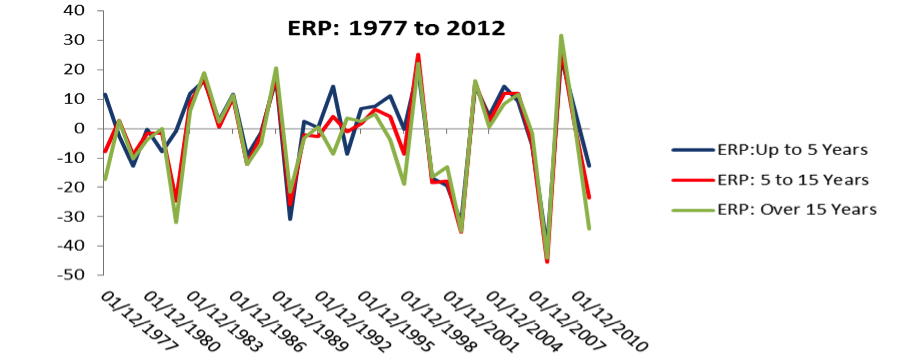
One of the first things we notice is that the longer duration gilts have outperformed equities on a number of occasions in our time period. Also, and as expected in declining markets, equities perform worse than gilts. This evidence makes it clear that choosing the benchmark risk free rate (making the assumption that gilts are risk-free) is crucial, and again highlights the importance of looking at as long a timeframe as possible. From this, we can now calculate the Equity Risk Premium historical data and as with our previous examples, the values have been calculated using annual geometric returns and are on a total return basis. Figure 9 illustrates this:
Figure 9: ERP and Bonds of Different Duration (Appendix 4)
It is noticeable that there is a close correlation between the three different lengths of gilts we are studying. The correlation between up to five years and five to fifteen years is 0.9143, up to five and over fifteen is 0.8 and five to fifteen and over fifteen is 0.9631. These correlations are as would be expected, with the adjacent time periods being more closely correlated. It is interesting to note, and as we have seen earlier, that the Equity Risk Premium is extremely volatile and is often negative. The periods which are most noticeable above all follow major crises as previously examined: 1998 and Long Term Capital Management, 2000 to 2002 witnessed the DotCom crash and 9/11, 2007/08 was the global financial crisis and most recently, 2011 was the onset of the Eurozone crisis. Looking at the earlier downturns, the first Gulf War (1990/91) had a greater impact than Black Monday (1987). 1982 saw the collapse of the Souk-Al –Manakh (Saudi Arabia’s unofficial stock exchange) and the continuation of the Iran-Iraq war. The ERP had its most consistent year across the three time periods in 2009, following the Bank of England’s first round of Quantitative Easing. Given this information, it is of value to illustrate the relative performance of the different duration bonds and the ERP:
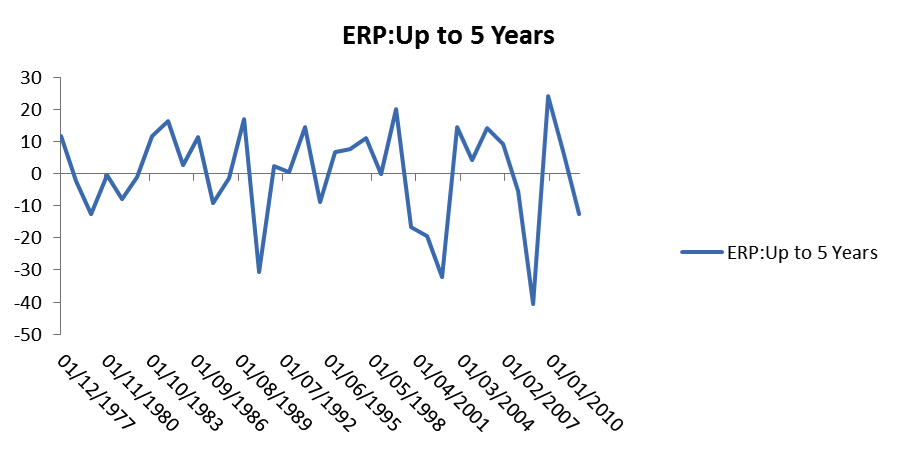
Figure 10: ERP and Gilts Up to 5 Years
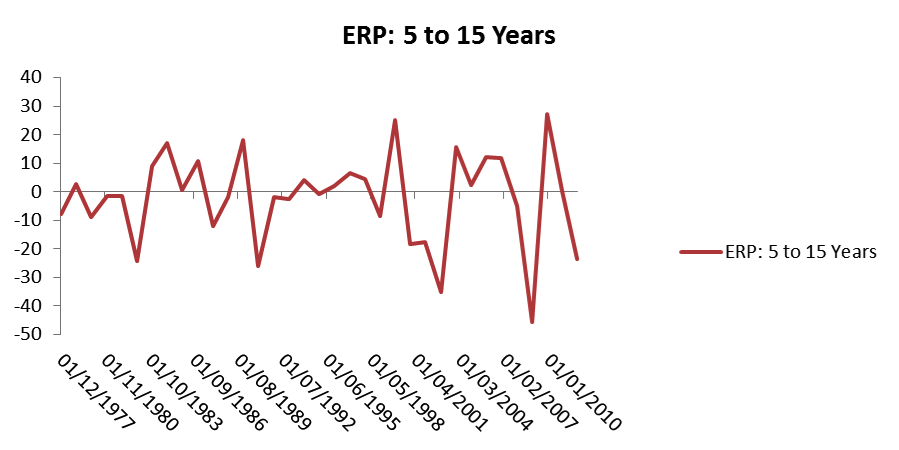
The correlation between these shorter term gilts and equity returns is 0.2835, the lowest of the three distinct bond durations we are looking at. This is as you would expect as there is the opportunity for greater volatility to have a greater impact over a shorter time period. For the next bond duration, five to fifteen years, the correlation is 0.3121. This is interesting as the correlation is increasing and perhaps the most noticeable feature is the increased downside volatility following the 2008 crisis.
Figure 11: ERP and Gilts 5 to 15 Years
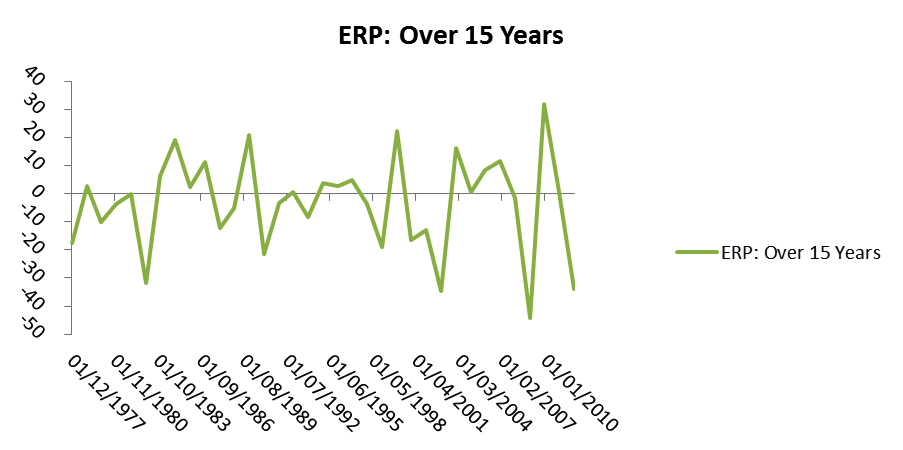
This is also reflected in the premium against gilts of over fifteen years. The principal difference is that we do not have an upside spike in the early years of this data. The overall pattern is very similar though and the total return correlation between these gilts and equities is 0.3485. This is in line with Dimson et al (2002, p.173) who observed that “in the United Kingdom, there was a fairly high correlation between annual equity returns and long bond returns (0.56)”. The higher correlation that they found would be a product of looking at data over a one hundred and one year period.
Figure 12: ERP and Gilts Over 15 Years
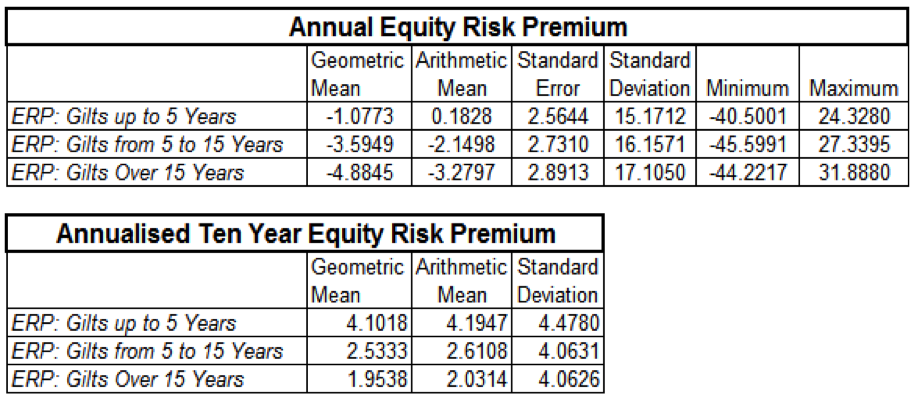
In the following table we can see a summary of the Equity Risk Premium historical data against gilts of different duration:
Figure 13: Risk Premia relative to Gilts of Differing Duration
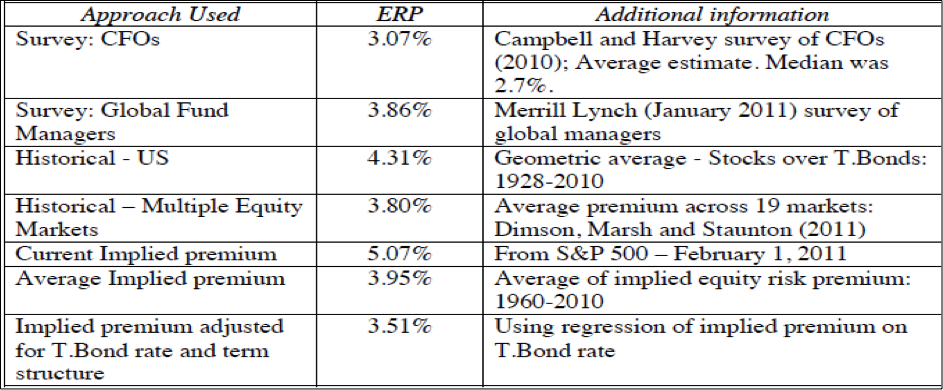
Comparing the standard deviations between the annual and ten year annualised Equity Risk Premium’s once more highlights the short-term volatility. For our period it also illustrates that seeking a reasonable premium for risk may involve staying in the market for a prolonged period. As we have seen though, this is still no guarantee of success if you have invested for twenty-five years or more and you have a repeat of, for example, 1929-32 or 200-02. In the tables above, the Equity Risk Premium historical data covers the period 1977 to 2012 and it is noticeable the difference between the annual and ten year premia, reinforcing the point made above. As we have noted before, and as mentioned by Dimson et al (2002), the geometric and arithmetic means are similar, reflecting a fairly stable environment. Dimson et al (2002) cite the Barclays Capital (1999) and CSFB (1998) research which calculated the UK ERP, relative to bills, to be 6.2%. Dimson and his co-authors found this to be 4.8%, on an annualised basis. It is clear from the figures above that it is much lower over our period. The annualised ten year ERP using gilts up to five years is the only one which comes close to matching that figure. It is interesting to compare this with Damodaran (2011, p.81) where he lists ERPs as of January 2011, these can be seen in the table below:
Figure 14: Estimated Equity Risk Premia (Damodaran 2011, p81)
As we can see these Equity Risk Premium are in a narrow range and cover a number of different time periods and surveys. Our Equity Risk Premium historical data covering a period of thirty five years is consistently lower than these estimates, with only the ERP calculated on annualised Gilts (Up to 5 Years), falling within the range. Again we have to consider the short time frame we are using data from but it does suggest that there is still a tendency to overestimate the risk premium.
Risk –Free Options
In a previous article we looked at the possibility of using interest rate swaps, adjusted for risk, as replacing gilts as the risk-free benchmark. To add to this, I would like to look at some specific short dated gilts and LIBOR. As we read, LIBOR is key to the process and it is interesting to look at some examples over our period to compare with the return. The inputs for understanding Equity Risk Premium historical data all vary in terms of the number of years available; I have therefore chosen data from the end of 2011 and will compare eight separate items which could be deemed as the risk-free rate. The purpose of this is to compare the various options for a risk-free rate and to highlight that the traditional method of measurement is changing. This is purely for comparative purposes and the work on my data in the remainder of this paper will be on gilts, as already explained. To be consistent I will pick the rates, as far as possible, from the last trading day of December.
Figure 15: Risk Free Alternatives
As we can see from the figures above, there are a number of alternative risk-free rates. We must remember though that there will not be universal acceptance of all of these options being risk-free. The key factor here is to determine which rate is the most relevant to the investment being considered and from this the risk premium may be determined. Damodaran (2011, p.81) summarises this concisely, no “matter what the premium used by an analyst, whether it be 3% or 12%, there is back-up evidence offered that the premium is appropriate.”
To conclude this article we have established that the Equity Risk Premium, for our time period, is lower than the consensus view of 6.2%, and also lower than Dimson et al’s (2002) 4.8%. The return on equities is also more closely correlated to the return on gilts of longer duration, again as proposed by Dimson et al (2002). Finally we have examined some options for a risk free rate rather than traditional gilts and it is apparent that there are a number which can be chosen. In my next article we will move on to look at the Prospective Equity Risk Premium.
References:
- Arnott, R.D. Equity Risk Premium Myths Rethinking the Equity Risk Premium (Edited by P. Brett Hammond, Jr., Martin L. Leibowitz, and Laurence B. Siegel) Research Foundation of CFA Institute (2011)
- Damodaran, A. (2011) Equity Risk Premiums (ERP): Determinants, Estimation and Implications – The 2011 Edition Stern School of Business
- Dimson, E., Marsh, P., and Staunton, M. (2002) Triumph of the Optimists: 101 Years of Global Investment Returns Princeton University Press
- Glassman, James K. “The price of TERRORISM” Kiplinger’s Personal Finance, Vol. 60 Issue 10, October 2006 p32-34,
- Vivian, A 2007, ‘The UK Equity Premium: 1901–2004’, Journal Of Business Finance & Accounting Vol 34 Issue 9/10, p.1496-1527
Twitter: @MillarAllan @seeitmarket
No position in any of the mentioned securities at the time of publication.
Any opinions expressed herein are solely those of the author and do not in any way represent the views or opinions of any other person or entity.

