The rebound in crude oil has been vicious. And while crude oil was rising, so were U.S. equities.
And this inevitably means that energy stocks have risen as well. And risen they have!
The S&P Energy Sector ETF (XLE) has been a market leader, along with industries like Oil & Gas Exploration and Production (XOP).
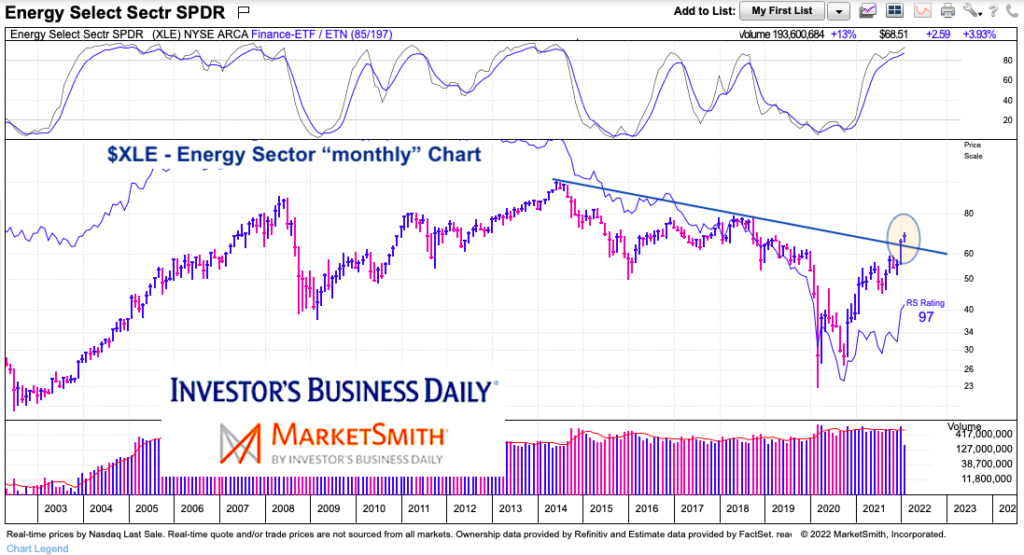
Today we take a simple, high level look at $XLE on a “monthly” price chart and highlight a major breakout attempt to kick off the new year.
Note that the following MarketSmith charts are built with Investors Business Daily’s product suite.
I am an Investors Business Daily (IBD) partner and promote the use of their products. The entire platform offers a good mix of analysts, education, and technical and fundamental data.
$XLE Energy Sector ETF Long-Term “monthly” Chart
There’s a lot to like about the energy sector (XLE) from a trend stand point. Big gains, leadership, rising oil prices, geopolitical tensions, etc. And to top that off, we are seeing $XLE attempt a major long-term breakout over its falling trend line.
So what am I watching? The 61.8% Fibonacci retracement of all-time highs to 2020 lows at $71.48. That’s a level that is right in front of us and it needs to be respected. A weekly close over that level would be a strong sign of conviction.
$XLE is red hot so a couple month consolidation wouldn’t hurt. If 71.48 is cleared, look for a move up to $80.

Twitter: @andrewnyquist
The author has a trading position in mentioned securities or similar at the time of publication. Any opinions expressed herein are solely those of the author, and do not in any way represent the views or opinions of any other person or entity.


