The coronavirus crash in the spring of 2020 left crude oil and natural gas prices decimated. An energy crisis was but a remote thought as oil and gas traded at multi-year lows.
Fast forward to today and what a difference 18 months makes!
Prices have surged. Late last month, we highlighted the breakout in Natural Gas prices, and today we are adding Crude Oil to the mix.
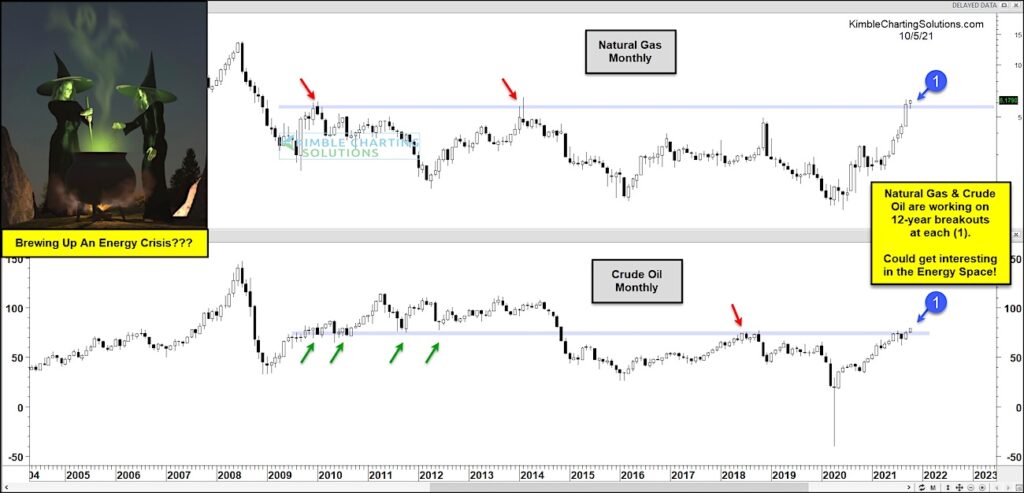
In today’s chart 2-pack, we wonder if the markets are “brewing up an energy crisis?” Below are long-term “monthly” price charts of Natural Gas and Crude Oil.
As you can see, Natural Gas and Crude Oil are working on breaking above 12-year price resistance at (1). Follow through to the upside would be concerning for energy prices and consumers (gas at the pump and heating bills at home!).
This is a critical intersection of time and price for the energy space. Stay tuned!
Natural Gas & Crude Oil Long-Term “monthly” Charts

Note that KimbleCharting is offering a 2 week Free trial to See It Market readers. Just send me an email to services@kimblechartingsolutions.com for details to get set up.
Twitter: @KimbleCharting
Any opinions expressed herein are solely those of the author, and do not in any way represent the views or opinions of any other person or entity.


