 The speed of the recovery from the decline in U.S. equities from late July to early August affirms it’s still a dip-buying environment. The market is telling you to stay long with discipline. As is often the case, the market-unsavvy did well this time by holding their holdings and going on vacation. And as I look across the universe of exchange traded products, iShares Emerging Markets ETF (EEM) jumps out at me as a potential opportunity to trade an asset that isn’t highly correlated to U.S. equities.
Let’s start with the chart structure and then come back to how EEM has behaved relative to the SPDR S&P 500 ETF (SPY) over the past few years.
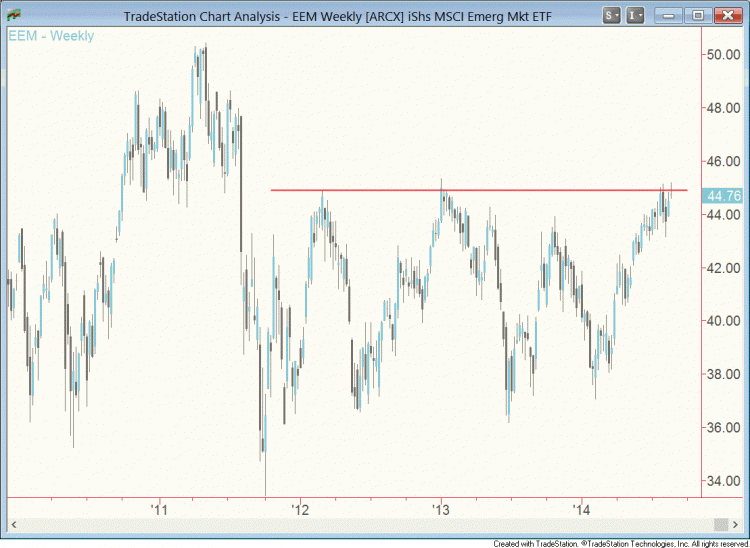
In early 2012 and again at the beginning of 2013, EEM approached or edged past 45.00 and went on to plummet in the months that followed. Here we are again: the Emerging Markets ETF has been probing that threshold since late July, so far without generating any follow-through buying. I don’t see any compelling evidence challenging the uptrend in this market that started in early 2014. At the last two peaks, daily momentum reached overbought conditions (warning a point of buyer exhaustion wasn’t far off) and had begun to slow. That isn’t the case right now – I use a two-day and 13-day average of the 14-day relative strength index to measure momentum, and this indicator is entirely neutral right now without any directional signals at all. I’d prefer to see some evidence of a climax before initiating a short trade.
Emerging Markets ETF (EEM) Weekly Chart
But keep in mind, even with a roomy stop loss around 46.00, risk is around a comfortable 3%. As long as you gauge your position size based on risk to your portfolio value (the guideline is never to risk 2% of your portfolio on any one trade, so be sure a 3% loss on the trade wouldn’t mean losing 2% or more of your portfolio value), it’s a relatively low-risk prospect. And the rationale is sound since you’d be going contrarian at a threshold that has thwarted the past two major advances in recent years.
Now consider EEM’s behavior compared with SPY. I avoid using the word “relationship” because arguably there isn’t one. Granted, over a very long time frame, the markets are positively correlated, although it’s been pretty variable since late 2012 (for reference, I’m measuring correlation on a weekly chart, looking at the preceding 12 weeks on a rolling basis). What interests me the most, though, is that fast downtrends in EEM from October 2013 to February 2014, and the first half of 2013, coincided with SPY marching higher. That makes a short EEM trade an attractive way to diversify a portfolio. There’s a chance it will fall even if SPY continues higher from here. And if SPY rolls over (and some of your holdings take a hit), there wouldn’t be any reason to expect EEM to go up. Keep in mind, every time SPY has dipped even mildly since the 2011 low, EEM has also gone down.
I hope this was of some use or at least provided some insight to everyone. Enjoy your the weekend.
No position in any of the mentioned securities at the time of publication. Any opinions expressed herein are solely those of the author, and do not in any way represent the views or opinions of any other person or entity.


