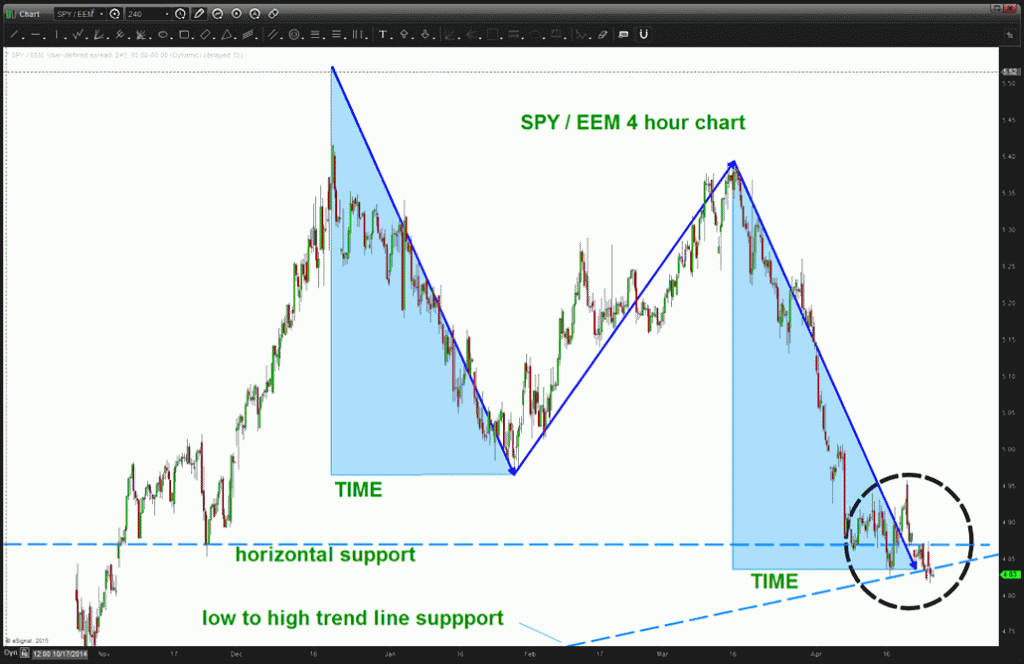
The Emerging Markets have been a hot topic as they have outperformed recently. I wrote about the S&P 500 (SPY) to Emerging Markets (EEM) relative strength ratio a couple weeks ago because it looked like it was headed into support. Well, now it’s time to provide a quick update on that SPY/EEM ratio.
In that post, we discussed the implications to the Emerging Markets while also showing the impact this ratio had on the U.S. Dollar and Crude Oil. From my prior post:
Is the PATTERN going to work for SPY/EEM and cause crude to tumble again and the dollar to continue it’s ascent? OR does the ratio fail at the levels shown and the dollar sells off while crude rallies ….?
Below you’ll find the updated resulting move in the relative strength ratio. I think it’s important to emphasize the importance of where we are – right now – for this ratio.
Note:
- The PRICE and TIME PATTERN present in the ratio… from a ratio perspective, it doesn’t get any better than this for patterns.
- The light blue dashed lines were highlighted above as trend line support and appear to be failing… but they need a bit more time so who knows.
S&P 500 (SPY) / Emerging Market (EEM) Ratio Chart
The Bottom Line: With this pattern present the ratio “should” start to rally as it’s a BUY PATTERN. We don’t know if that is going to happen or not. It’s just a probability ….
What we do know is IF (the big IF) it fails then the dollar correction will continue lower… stay tuned and have a great week.
Also read: “A Relative Strength Breakout For Emerging Markets?” by Jonathan Beck
Follow Bart on Twitter: @BartsCharts
No position in any of the mentioned securities at the time of publication. Any opinions expressed herein are solely those of the author, and do not in any way represent the views or opinions of any other person or entity.


