Those of you who read my predictions know that I am long term bullish in alternative energy and in electric vehicles.
Looking domestically, recent price cuts in EVs have spurred new buyers.
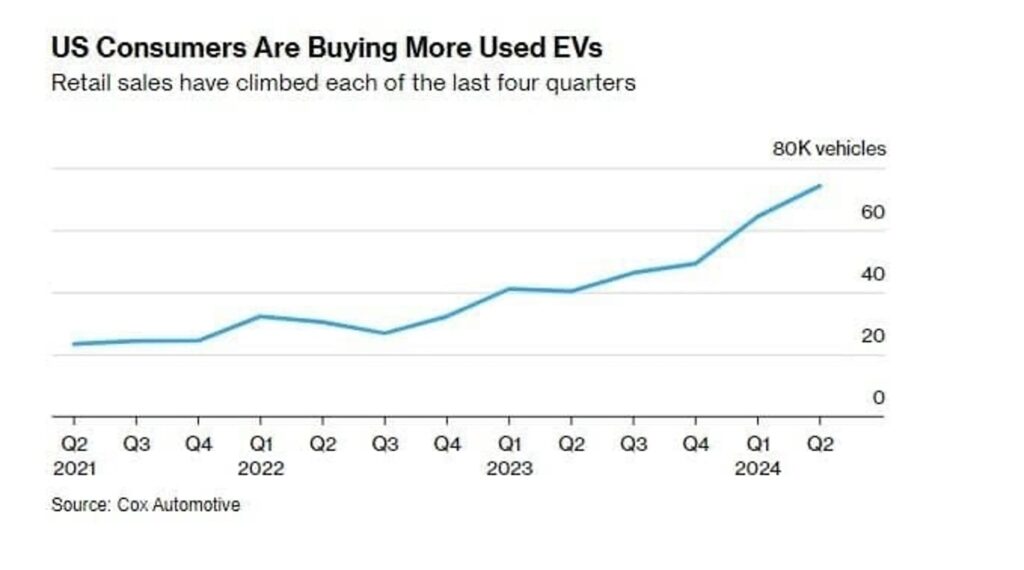
According to Bloomberg, a growing trend across the U.S., including in Tesla’s hometown of Fremont, shows used EV sales jumping 70% in the year’s first half, according to Cox Automotive.
Simple economic formula is that when supply exceeds demand, that leads to lower prices.
The EV inventory has quadrupled since 2021.
Plus, used EVs take longer to sell than gas-powered cars.

Nonetheless, price pays, and so used EV models priced between $20,000 and $30,000 sell faster, reportedly within 30 to 36 days compared to 39 days for gas cars.
However, let’s look at the other side of the equation.
Jobs in clean energy vehicles grew by 11% in 2023, with the fastest growth in battery-electric vehicles.
But major carmakers have pulled back or scrapped altogether some of their EV plans due to the waning appetite.
This is exactly how simple economics works.
Producers see rising supply and low demand.
So, they reduce production.
Then, demand rises when prices become compelling (remember tax credits in EVs exist) which can lead to producers being short on supply.
We will see the shift in the charts.
Click here to see the chart on Tesla and Rivian, plus levels for key ETF indices and sectors.

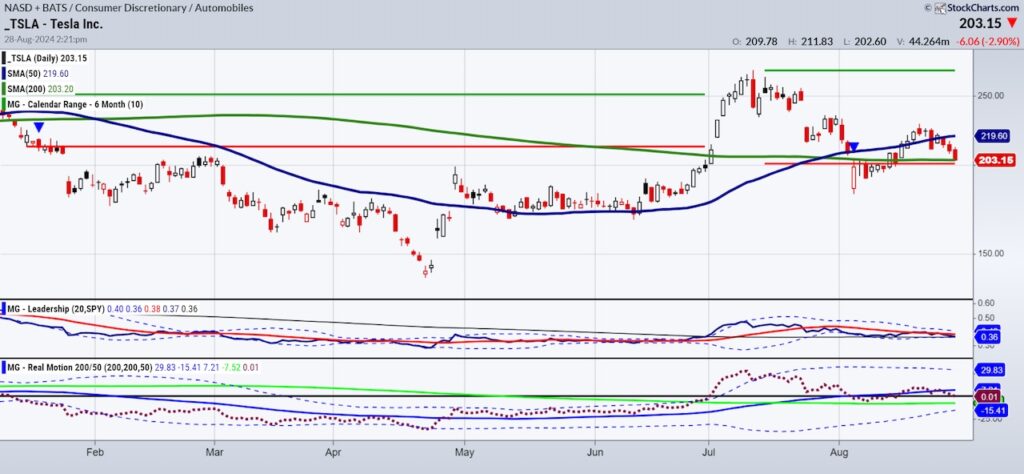
Tesla had a beautiful bottoming pattern in April 2024.
Since then, the massive price consolidation period the stock saw from May through July is now acting as support.
What is extremely interesting is that the support from that period corresponds well with both the 200-DMA and the July 6-month calendar range low.
That tells us that current levels at around 204 are important to hold and if they do, the stock presents a low risk buy opportunity.
Tesla is underperforming the benchmark.
The momentum indicator remains in a slight bullish divergence.

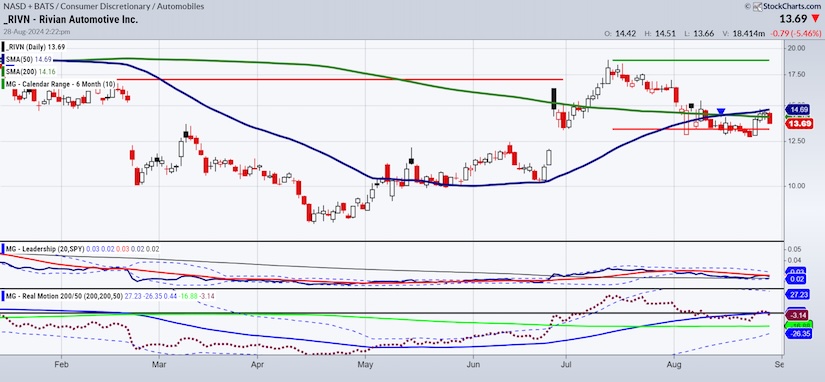
Rivian appears to have bottomed in April 2024.
Since then, the trading range is 12.50-19.00.
Currently, Rivian is breaking back down under both the 50 and 200-daily moving averages. However, this is unconfirmed and will resolve one way or another tomorrow.
Rivian has improved performance against the benchmark.
And the momentum indicator tells us that there is a bullish divergence.
The July 6-month calendar range low is holding.
Longer term, we like Rivian. Shorter term we would like to see the stock return over 15.00.
As far as a shift to a sustained buy in EV stocks, both Tesla and Rivian are following the overall market moves, and both look worth watching at these levels.
Hence, the bigger trend (like the “vanity” trade I wrote about yesterday), will most likely develop legs in 2025.
Twitter: @marketminute
The author may have a position in mentioned securities at the time of publication. Any opinions expressed herein are solely those of the author and do not represent the views or opinions of any other person or entity.


