The world is full of economic concerns. Inflation, economic slowdown, global trade, and international war.
So what’s next?
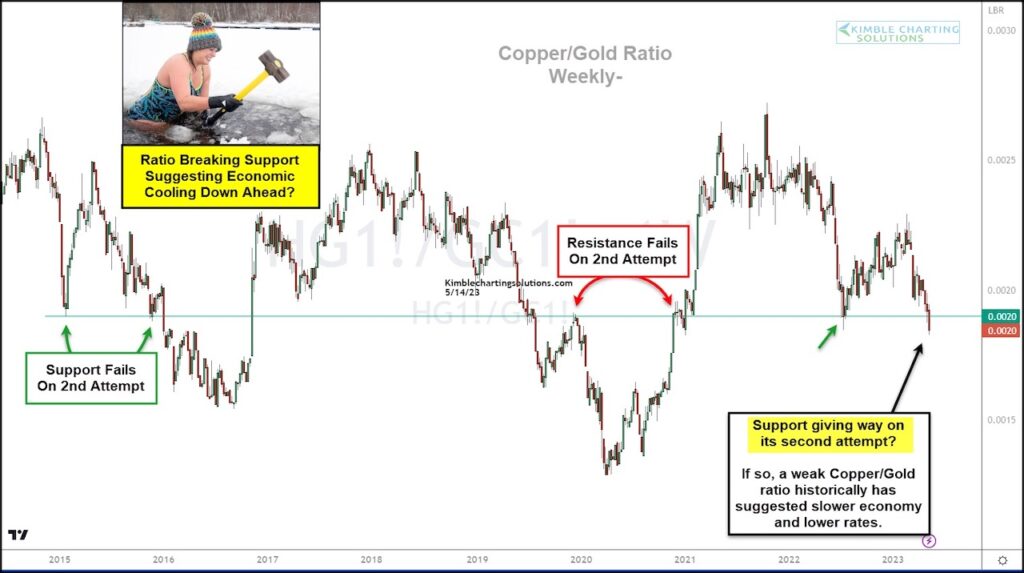
Today’s chart might just might share a glimpse into the future. Below is a “weekly” chart of the Copper to Gold price ratio.
Typically, when this ratio is rising, the economy is strong and interest rates are firm to rising. But when its falling, there is a great degree of economic uncertainty and rates tend to follow lower.
Recently, the Copper to Gold ratio closed below the lows of last year.
If history is a guide, a break of support here would suggest a lower risk of inflation and higher odds of interest rates falling. And perhaps an uncertain economy as well. Stay tuned!
Copper to Gold Price Ratio “weekly” Chart

Note that KimbleCharting is offering a 2 week Free trial to See It Market readers. Just send me an email to services@kimblechartingsolutions.com for details to get set up.
Twitter: @KimbleCharting
Any opinions expressed herein are solely those of the author, and do not in any way represent the views or opinions of any other person or entity.


