On Tuesday, DR Horton NYSE: DHI reported fiscal Q2 earnings. And its stock price surged.
The company reported adjusted EPS of $1.30, which beat consensus estimates of $1.12. Revenues came in at $4.5B, which missed consensus estimates of $4.57B.
DR Horton (DHI) noted an increase in sales cancellations and decrease in month-to-date orders due to COVID-19.
The company withdrew its fiscal 2020 guidance.
Heading into the earnings report, DHI was down 32.67% from February 2020 highs. The stock rallied over 10% midway through Tuesday’s trading session.
Let’s review our weekly analysis.
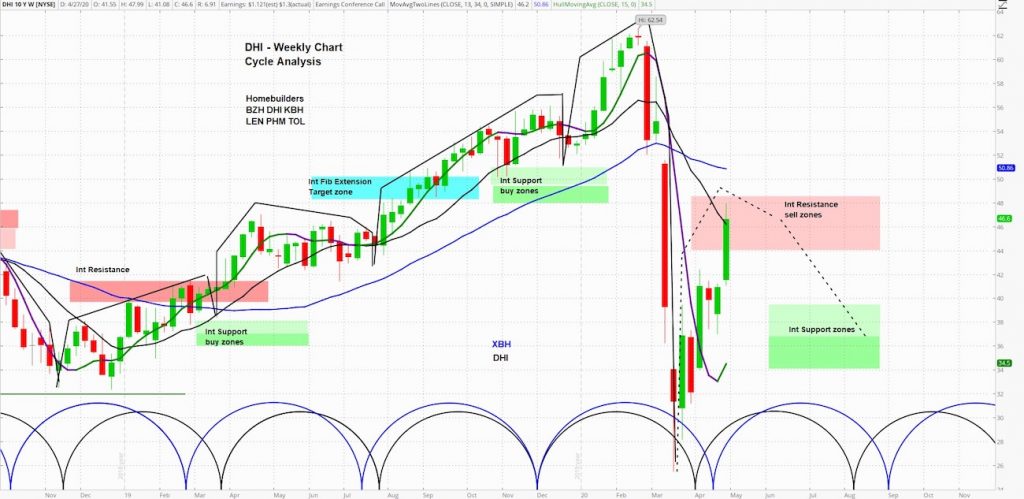
DR Horton (DHI) Chart

At askSlim we use technical analysis to evaluate price charts of stocks, futures, and ETF’s. We use a combination of cycle, trend and momentum chart studies, on multiple timeframes, to present a “sum of the evidence” directional outlook in time and price.
askSlim Technical Briefing:

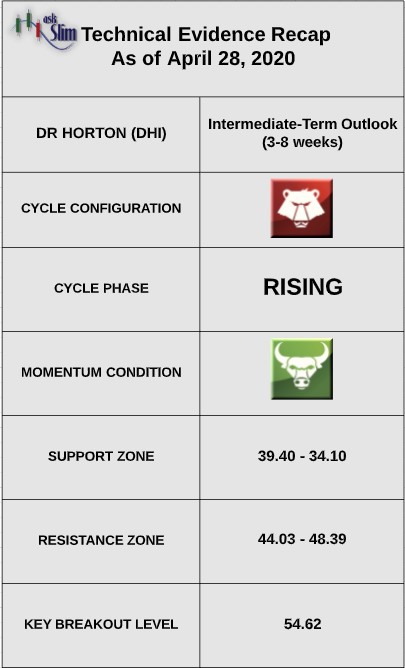
The weekly cycle analysis suggests that the stock is in a rising phase in an overall bearish pattern. The next projected intermediate-term low is due in August.
On the upside, there is an intermediate-term resistance zone from 44.03 – 48.39. On the downside, there is a support zone from 39.40 – 34.10. For the bulls to regain control of the intermediate-term, we would need to see a weekly close above 54.62.
askSlim Sum of the Evidence:
DHI is testing an intermediate-term resistance zone in an overall bearish pattern. We would expect the stock to fail in this zone between 44 – 48 and pullback to 37 by August.
Interested in askSlim?
Get professional grade technical analysis, trader education and trade planning tools at askSlim.com. Write to matt@askslim.com and mention See It Market in your email for special askSlim membership trial offers!
Twitter: @askslim
Any opinions expressed herein are solely those of the author, and do not in any way represent the views or opinions of any other person or entity.


