Dow Jones Transportation Average ($DJT)
At askSlim we use technical analysis to evaluate price charts of stocks, futures, and ETF’s. We use a combination of cycle, trend and momentum chart studies, on multiple timeframes, to present a “sum of the evidence” directional outlook in time and price.
askSlim Technical Briefing
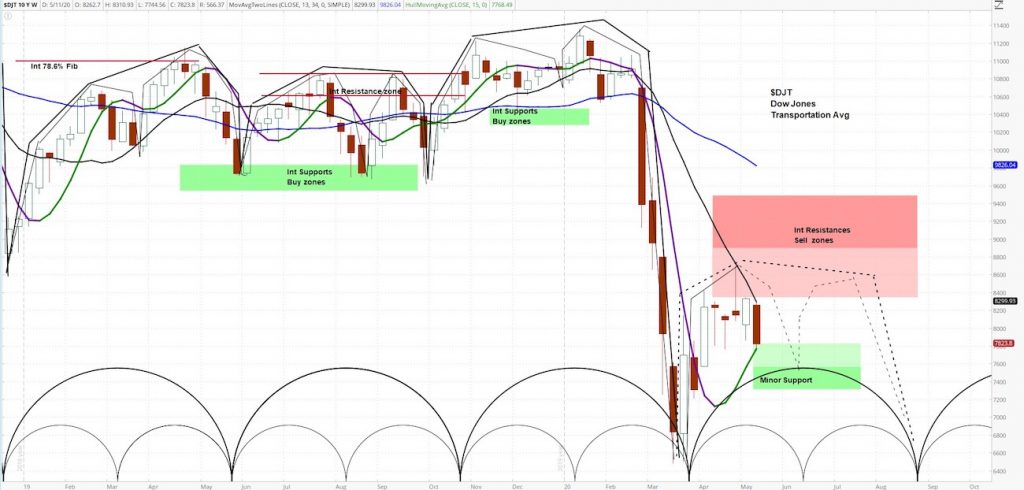
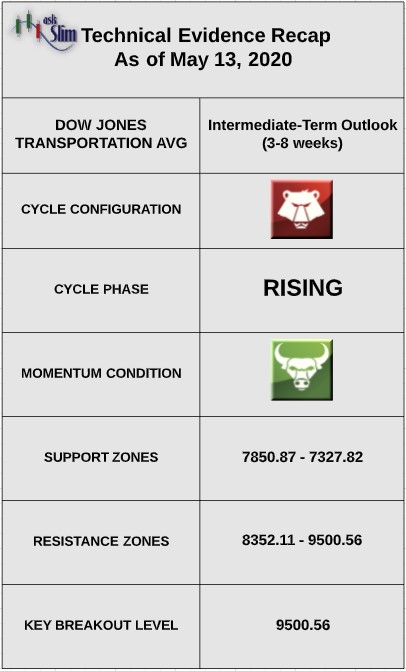
The weekly cycle analysis suggests that the $DJT is nearing the end of a rising phase. Weekly momentum is positive.
On the upside, there are intermediate-term resistances from 8352.11 – 9500.56. On the downside, there are intermediate-term supports from 7850.87 – 7327.82. For the bulls to regain control of the intermediate-term, we would need to see a weekly close back over 9500.56.
askSlim Sum of the Evidence
The Dow Jones Transportation Average fell over 42% from peak to trough and is now likely to have an extended period of consolidation. We would expect the index to trade between the intermediate-term resistances beginning at 8352 and the intermediate-term supports beginning at 7850 through the end of June. Our analysis suggests that there is a heightened period of downside risk in July and August of this year.
Interested in askSlim?
Get professional grade technical analysis, trader education and trade planning tools at askSlim.com. Write to matt@askslim.com and mention See It Market in your email for special askSlim membership trial offers!
Twitter: @askslim
Any opinions expressed herein are solely those of the author, and do not in any way represent the views or opinions of any other person or entity.
 and Semiconductors (SMH)")
")
 Make A Higher Low?")


