In early 2018 the major stock market indices peaked and gave way to a short-term correction. That peak, though, was likely the start of an 18-24 month consolidation.
Since that time, the S&P 500, Nasdaq, Nasdaq 100, and Dow Jones have made marginal new highs (2-5 percent higher). The Russell 2000 has not… and remains 12 percent below its early 2018 highs.
As well, several other indices like the NYSE Composite and S&P Mid-Caps have remained under the highs, creating bearish divergences and reasons for investors to remain picky and cautious. We’ve also seen several sell-offs and bursts of volatility during this time.
Today, we look at Dow Theory and discuss yet another divergence between the Dow Industrials INDEXDJX: .DJI and Dow Transports INDEXDJX: DJT and what it means for the market.
Note that the following MarketSmith charts are built with Investors Business Daily’s product suite.
I am an Investors Business Daily (IBD) partner and promote the use of their products. The entire platform offers a good mix of technical and fundamental data and education.
Dow Jones Industrial Average “Daily” Chart
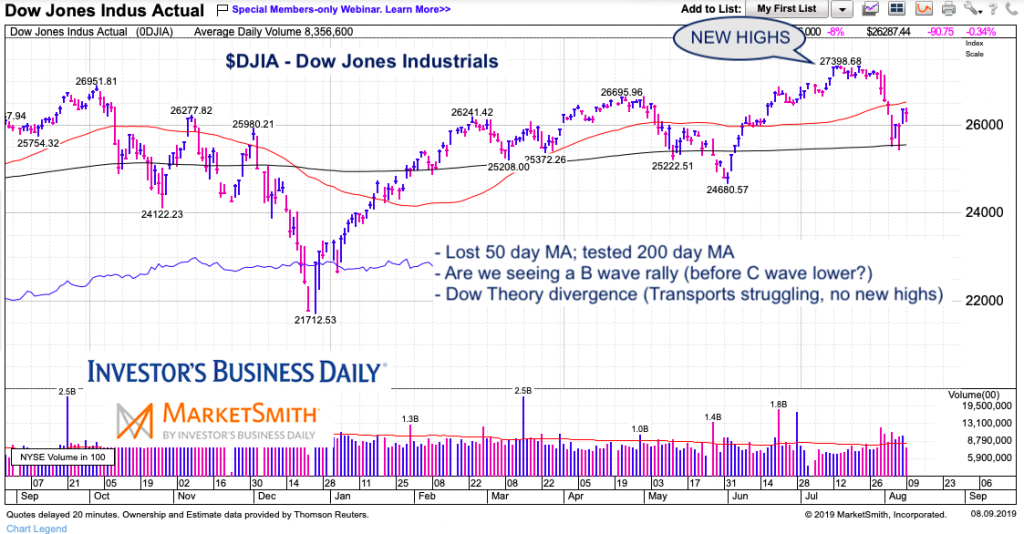
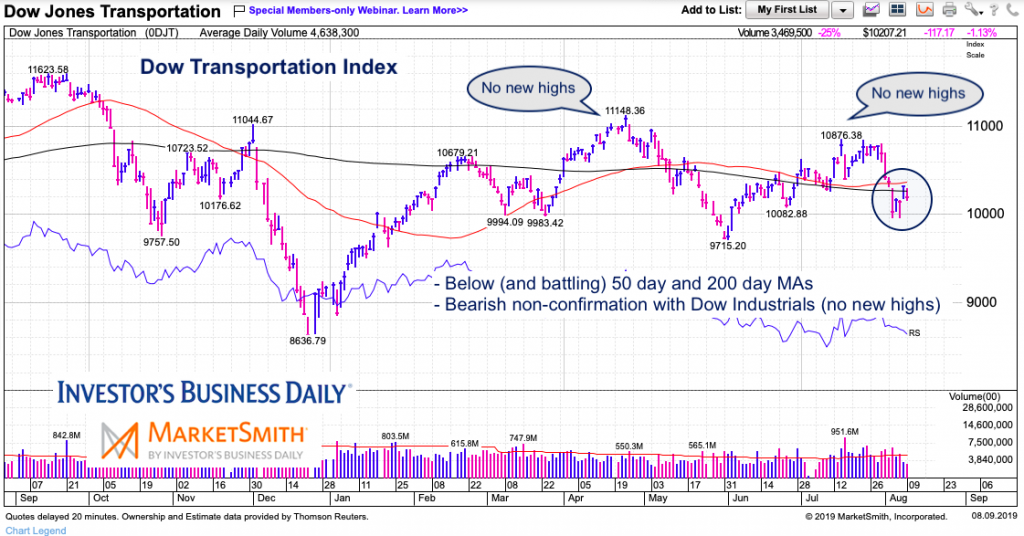
Dow theory says that both indices should confirm one another. For instance, if one makes new highs, a new bull market leg higher is confirmed when the other does as well (in sync). When one makes new highs and the other doesn’t, it’s a non-confirmation.
That is precisely what we have today. As you can see in the charts below, the Dow Industrials have been in consolidation with a bullish bent. The Dow Transports have not – no new highs and falling moving averages.
Until this (and other divergences) begin to change, the market will be in a broad consolidation (a 15 percent range or so). I’m thinking another 6 months or so.

Dow Jones Transportation Average “Daily” Chart

Twitter: @andrewnyquist
The author may have a position in mentioned securities at the time of publication. Any opinions expressed herein are solely those of the author, and do not in any way represent the views or opinions of any other person or entity.


