Dow theory can be a valuable tool to have in your toolkit. Especially if you keep the confirmation and non-confirmation signals in perspective of their given timeframe. On March 2nd, when the markets were near peak levels, I posted a research note on Dow Theory highlighting the weakness in the Dow Jones Transportation Index (DJT). That wasn’t a call for a market top, but rather a call for some caution as I felt the Dow Theory non confirmation signal was something investors should be aware of.
As will all signals, some work, some don’t. It’s why we keep our tool kit handy and the research flowing.
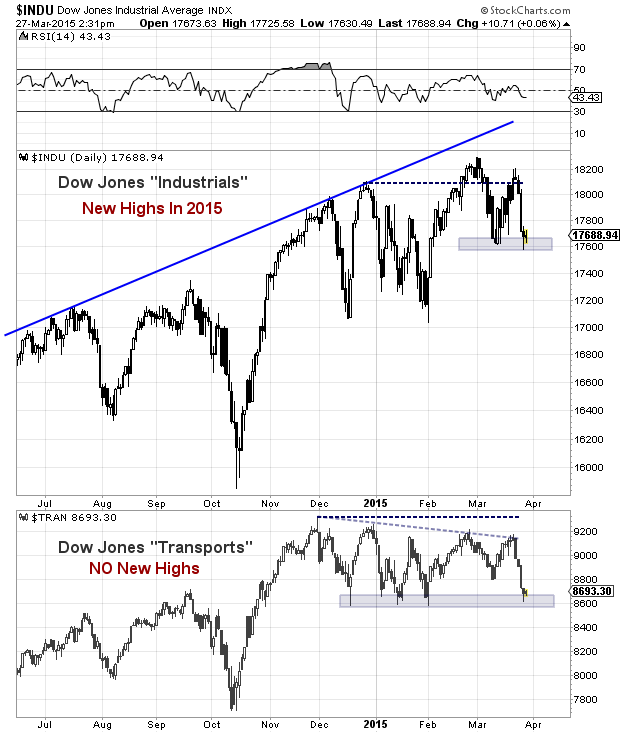
 The markets have become more volatile over the past 3 or 4 weeks, as the Dow Jones Industrial Average (DJIA) has now followed the Transports lower. The Industrials are now down 3.4 percent off the 2015 highs while the Transports are down 7.8 percent off the November highs.
Perhaps of more importance near-term, both averages are sitting on important near-term price support. The Industrials are currently hanging out near the March lows, while the Transports are testing a band of lower support made up of the December, January, and February lows.
If these supports break (especially together), it would be an ominous sign for the broader market near-term in my humble opinion.
Below is an updated chart.
Dow Theory Non Confirmation Signal – Spring 2015
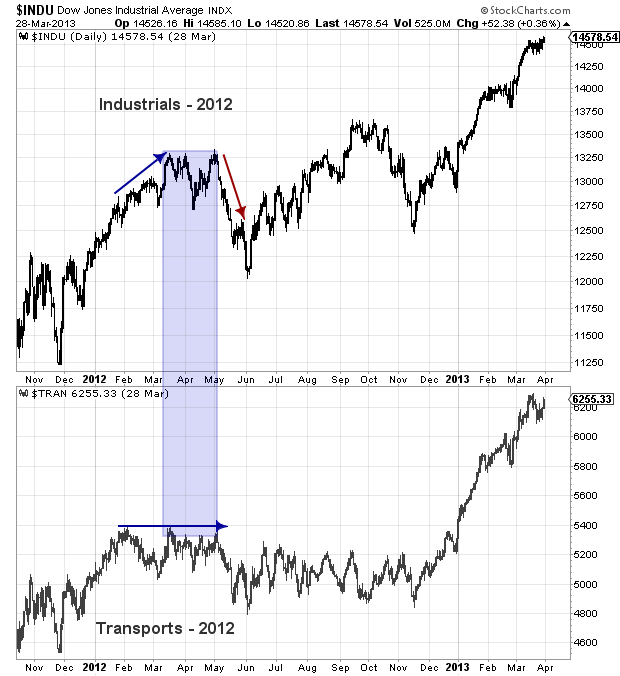
Lastly, I want to once again share the chart of the Dow Theory non confirmation signal that occurred in the Spring of 2012. No two market periods are the same, but this is a good example of how a Dow Theory non confirmation (divergence) can take hold (and take the markets lower, or alternatively, higher).
Dow Theory Non Confirmation Signal – Spring 2012
Thanks for reading and trade safe.
Follow Andy on Twitter: @andrewnyquist
No position in mentioned securities at the time of publication. Any opinions expressed herein are solely those of the author, and do not in any way represent the views or opinions of any other person or entity.


