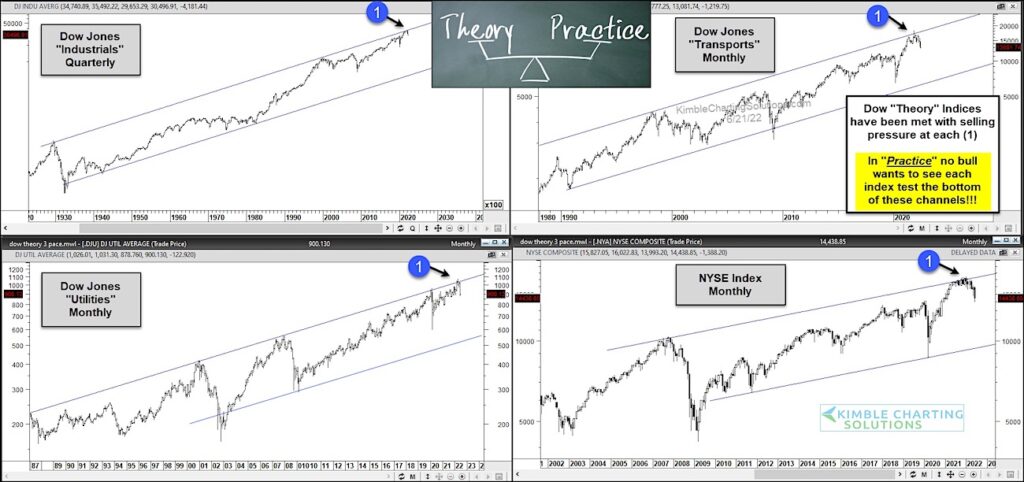
For the past century, investors have use the tried and true Dow Theory sell signal as a bear market warning. Though the transportation sector is much different than it once was, it still carries importance today.
Several indices are already in a bear market, so concerns are already high… and sell signals abound.
That said, I thought it would be a good exercise to look at 4 key indices that make up a more broad based Dow Theory (I’ve included the Dow Jones Utilities and NYSE Index).
The charts are long-term and the selling (and damage) is obvious. But, more importantly, we can see that these long-term charts have been in a broad rising up-trend channel. And each index reached resistance and started its decline from the upper trend channel… and is now in decline.
Clearly, these Dow Theory Indices are each struggling at long-term resistance. In practice, no bull investor wants to see each index test the bottom of these channels. That would be really ugly. Stay tuned!
Dow Theory stock market Indices long-term Charts

Note that KimbleCharting is offering a 2 week Free trial to See It Market readers. Just send me an email to services@kimblechartingsolutions.com for details to get set up.
Twitter: @KimbleCharting
Any opinions expressed herein are solely those of the author, and do not in any way represent the views or opinions of any other person or entity.
On June 22, 2022 10:31am this article was edited to correct a misspelling. The word “now” has been changed to “no”.


