Utilities stocks have been surging higher this year.
Once thought of as a conservative hedge-like allocation for investors, Utilities have been performing like tech stocks of late.
Can this the rally continue?
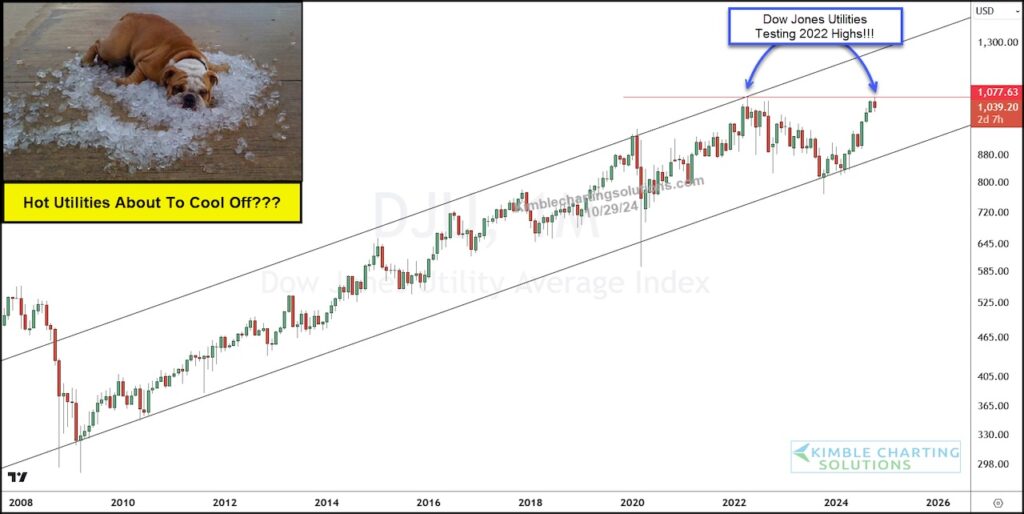
Today we draw your attention to a long-term “monthly” price chart of the Dow Jones Utility Average to highlight a potential fork in the road.
As you can see, the Utes have been in a rising price channel (up-trend) for the past 15 years. You’ll also notice this year’s white-hot rally. BUT the recent rally has taken the Utilities back to the 2022 highs. And this looks like significant resistance.
Will be interesting to see how white-hot Utes handle 2022 highs! Pullback or breakout? Stay tuned!
Dow Jones Utility Average “monthly” Chart

Twitter: @KimbleCharting
The author may have a position in mentioned securities. Any opinions expressed herein are solely those of the author, and do not in any way represent the views or opinions of any other person or entity.


