The stock market has continued to ramp higher in 2017.
But, as we enter summer, the Dow Jones Industrial Average (INDEXDJX:.DJI) may be nearing a major top.
Time To Check The Price Pivots…
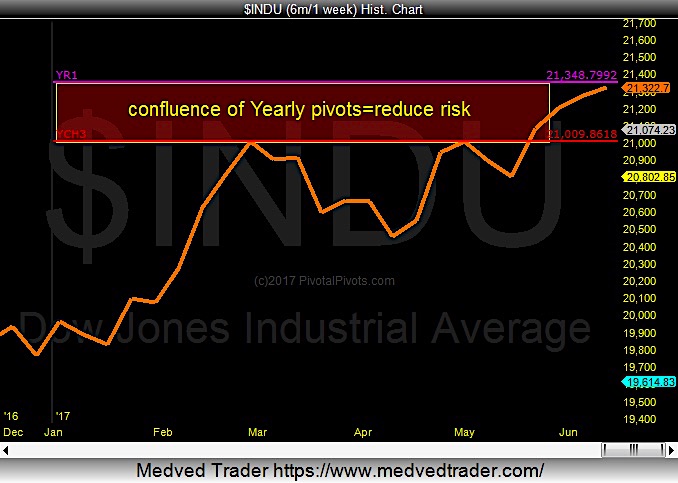
The Dow Jones Industrial Average is testing strong resistance at the YearlyR1 Pivot at 21,350. YearlyR1 Pivot Points have a high odds(74%) for a big price reversals(average 1,000+pts.). My research at PivotalPivots.com has shown, the biggest price reversals of the year, happen at the Yearly Pivot Points. Shorter term reversals occur at the monthly and weekly pivot points. The reason is many computer black box algorithms are programmed to buy and sell at Pivot Points.
Dow Jones Industrials Chart – 2017 Year Price Pivot (YR1)
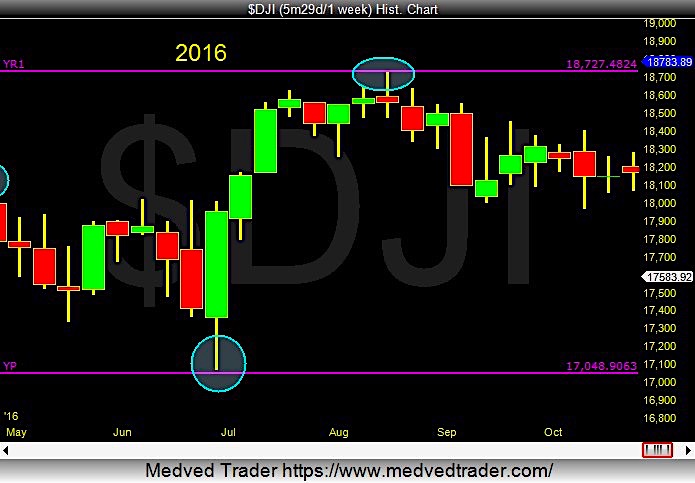
Last summer(2016) the $DJIA fell 800 points after testing the YearlyR1 Pivot(Yr1).
Here is the 2016 DJI chart:
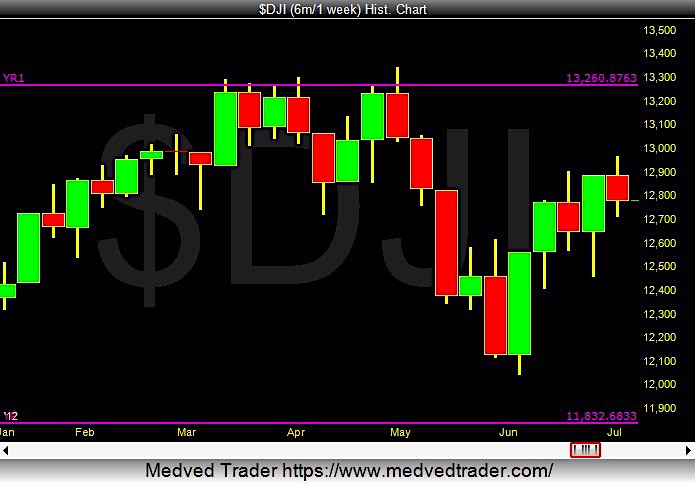
And in 2012 the $DJI fell 1,250 points after testing Yr1 Pivot.
Here is is the 2012 $DJI chart:
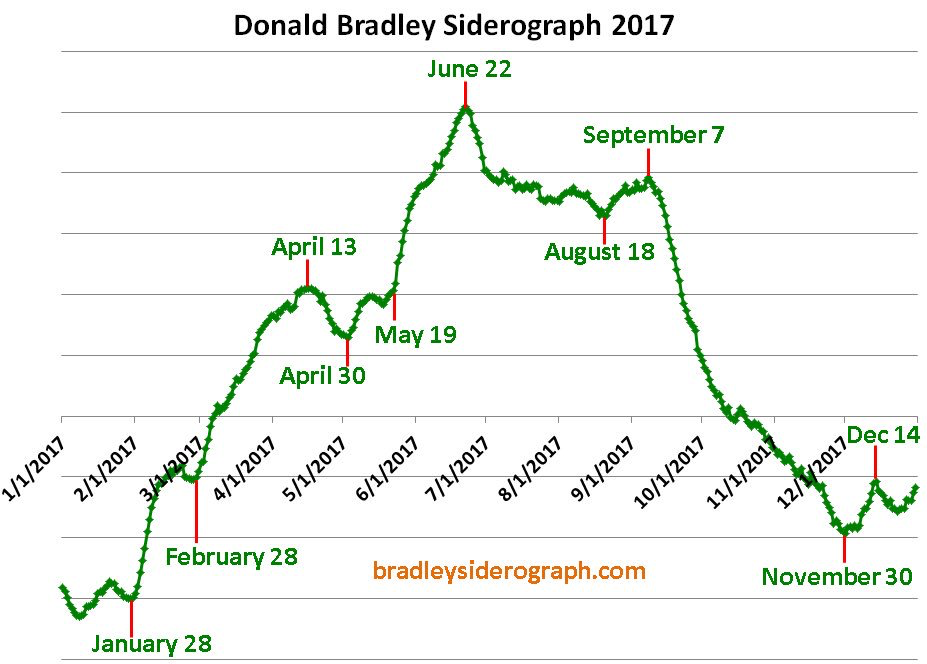
Also, the 2017 Bradley Model Siderograph shows a major trend change date coming up in the days/weeks ahead! Donald Bradley created the Siderograph in the 1940’s for the Dow Jones Index and wrote a famous book called “Stock Market Predictions”. It is out of print. His work is still followed by many Wall Street insiders. It is uncanny accurate, but sometimes a week or two late. The chart below is from BradleySiderograph.
If the 2017 Bradley model is correct the stock market could top out soon and pull back 5-10% by November.
It has been exactly 10 years since the last financial crisis. Is the next crisis right around the corner? I feel this is a good time to take some long-term profits off the table or hedge!
Know in advance where the “Pivots Points” are with my private service on my site PivotalPivots. Thanks for reading!
Twitter: @Pivotal_Pivots
The author may have a position in mentioned securities at the time of publication. Any opinions expressed herein are solely those of the author, and do not in any way represent the views or opinions of any other person or entity.


