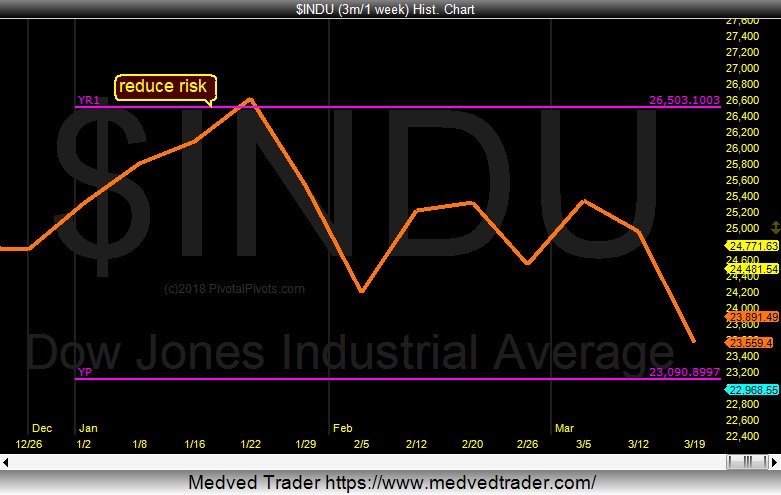
The Dow Jones industrial average index (INDU/DJIA) is near KEY price support.
That support resides at its Yearly Pivot (YP) at 23,090.
The high this year was at the Yearly R1 Pivot Point (YR1). This will complete a pivot price pattern from the Yearly R1 Pivot down to the Yearly Pivot (YP).
Computer algorithms like to move price from pivot point to pivot point.
Look for KEY support this week at 23,000. A close below 23,000 could open the door for the YearlyS1 Pivot Point (YS1) at 21,300 in 2018. But if 23,000 holds, then maybe the Dow Jones Industrials will retest the high of the year at 26,666.
23,000 is the line in the sand for the bulls in 2018!
Dow Jones Industrial Average Chart – Near Pivot Support!
The BIGGEST reversals happen at the Yearly Pivots. The PivotalPivots methodology shows you in advance where the highest odds are to add and reduce risk.
Know In advance where these key Pivots are at on Pivotal Pivots or catch me on Twitter.
Twitter: @Pivotal_Pivots
The author may have a position in mentioned securities at the time of publication. Any opinions expressed herein are solely those of the author, and do not in any way represent the views or opinions of any other person or entity.


