The financial markets are ablaze with talks of trade wars, central banks and negative interest rates, and global political theater.
Interesting times, for sure.
As active investors, we need to be sure that we remain focused on our method/plan within our given timeframes.
For today’s update, I take a look at the Dow Jones Industrial Average and simply look to highlight a few nuggets across an short- to intermediate-term timeframe. As I have mentioned before, I view the Dow Industrials as more of global index and believe that global investors do as well. So, in a very broad context, the Dow Jones Industrial Average’s performance can provide context to capital flows and sentiment.
Note that the following MarketSmith charts are built with Investors Business Daily’s product suite.
I am an Investors Business Daily (IBD) partner and promote the use of their products. The entire platform offers a good mix of technical and fundamental data and education.
Dow Jones Industrial Average Chart
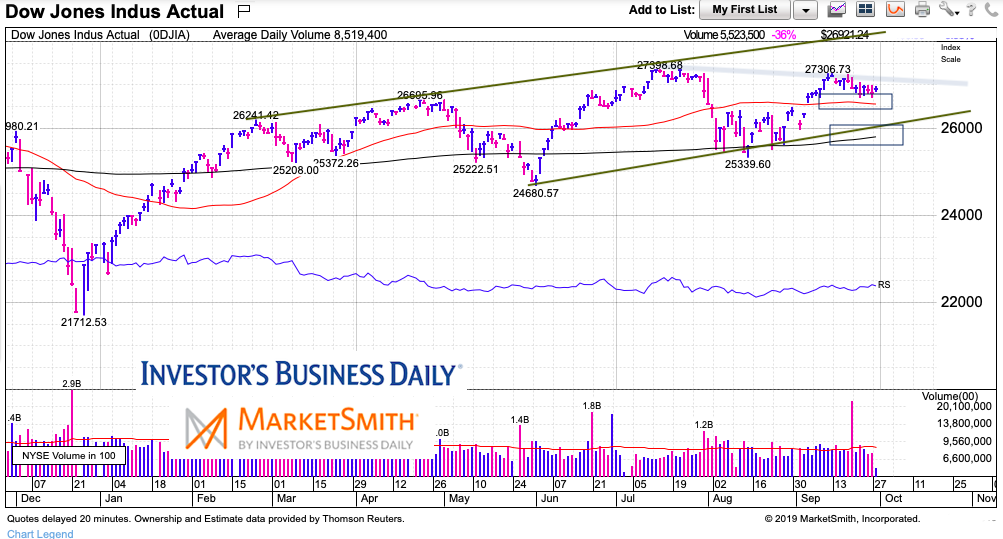
After last December’s “V” bottom, the market rallied sharply into February. Since then, it’s been a wild ride… but all within the context of a rising trend channel (see below).
The market has bounced off the upper and lower channel lines multiple times, producing some big rallies and declines. As well, it has mostly respected the 200 day moving average.
The current setup has the Dow Industrials in the middle of the channel, hovering just above the 50 day moving average and gap-fill support. If this area is lost, then the Dow may look to test the lower rising trend line and 200 day moving average area.

Twitter: @andrewnyquist
The author may have a position in mentioned securities at the time of publication. Any opinions expressed herein are solely those of the author, and do not in any way represent the views or opinions of any other person or entity.


