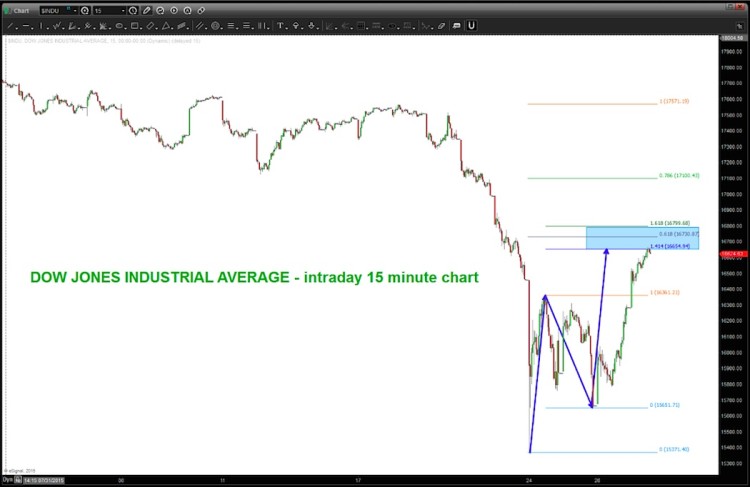
Monday was pretty scary for traders. Whether that’s just a trading bottom or a more meaningful bottom, no one knows just yet. But it does appear that the rally out of Monday’s deep decline in the Dow Jones Industrial Average (DJIA) has reached a critical technical resistance level for traders.
That level comes in at 16,655 (a measured move). Notice today’s close. Bingo – right at 16,655. (see chart below for reference)
Furthermore, the markets reaction in and around this technical resistance level will likely give us a heads up for the next directional move (in my opinion). If the Dow Jones Industrial Average decides to move higher, other Fibonacci levels are highlighted.
Dow Jones Industrial Average – 15 Minute Chart click to enlarge
Trade safe and with discipline. Thanks for reading.
Twitter: @BartsCharts
Author does not have a position in mentioned securities at the time of publication. Any opinions expressed herein are solely those of the author, and do not in any way represent the views or opinions of any other person or entity.


