“TIME is the most important factor in determining market movements and by studying the past records of averages or individual stocks you will be able to prove for yourself that history does repeat and that by knowing the past you can tell the future.” – W.D. Gann, 1939
The analysis and forecasts presented in this article are based on the analytical framework of W.D. Gann.
Gann is an investing legend, labeled as genius by many financial historians. He reportedly accumulated $50 million in profits during his trading career. His superior track record and those of others using his methods argues that, regardless of our opinion of his methodology, we should heed the advice of his work.
A more detailed explanation of his analytical framework is included in the last section of this article.
Dow Jones Industrial Average Forecast: 2018-2020
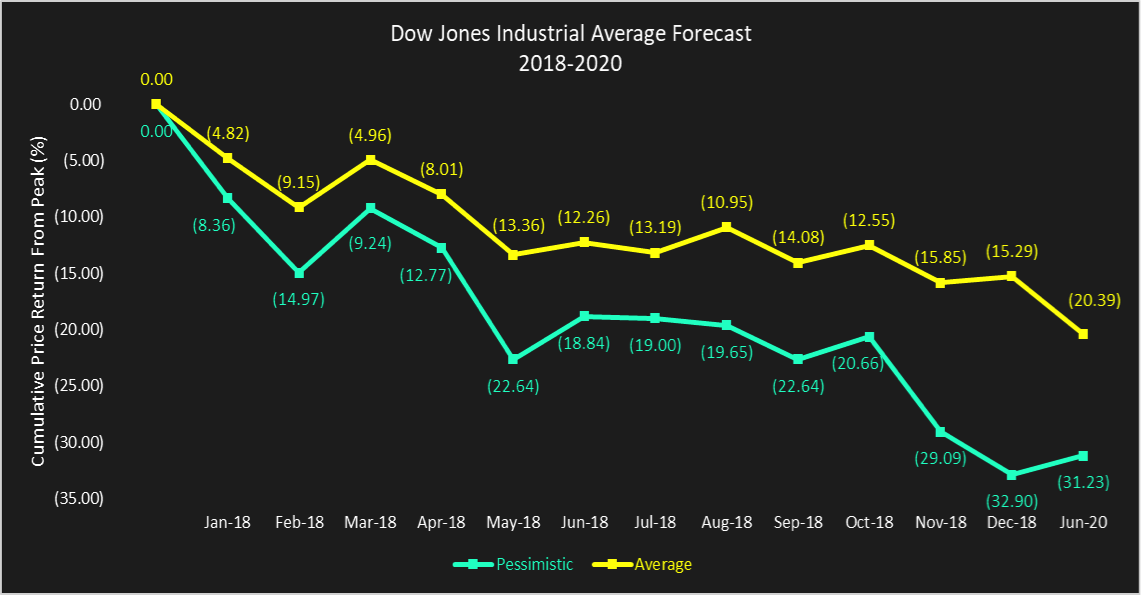
The Dow Jones Industrial Average forecast, in the graph above, is based upon the natural 20-year cycle that Gann identified. The lines in the graph show the projected monthly cumulative percentage returns from the peak level. The yellow line is the average scenario and the aqua line is the pessimistic scenario. The graph provides monthly estimates for 2018. The last data point represents June 2020, which covers the entire 30-month period from December 2017.
My average scenario forecasts a -15.29% price return for 2018. The cumulative price return is forecast to bottom in June 2020 at -20.39%, at which time an extended rally should ensue.
My pessimistic scenario forecasts a -32.90% price return for 2018. The cumulative price return is forecast to be little-changed in June 2020 at -31.23%, at which time an extended rally in should ensue.
20-Year Cycle: Timing Analysis
The New York Stock Exchange (NYSE) began trading operations in 1792. However, the natural cause of the 20-year cycle first occurred in 1801. Accordingly, a proper analysis of the 20-year cycle must begin with 1801 as a starting point. The explanation for this is provided in the section entitled The Natural Cause of the 20-Year Cycle.
The 20-year cycles, from the inception of the NYSE, consist of the following time periods: 1. 1801-1820, 2. 1821-1840, 3. 1841-1860, 4. 1861-1880, 5. 1881-1900, 6. 1901-1920, 7. 1921-1940, 8. 1941-1960, 9. 1961-1980, 10. 1981-2000, and the current cycle 11, 2001-2020. Due to limitations of acquiring historical data, the data set of the Dow Jones Average used in this analysis consists of monthly closing prices beginning in January 1901, the sixth 20-year cycle.
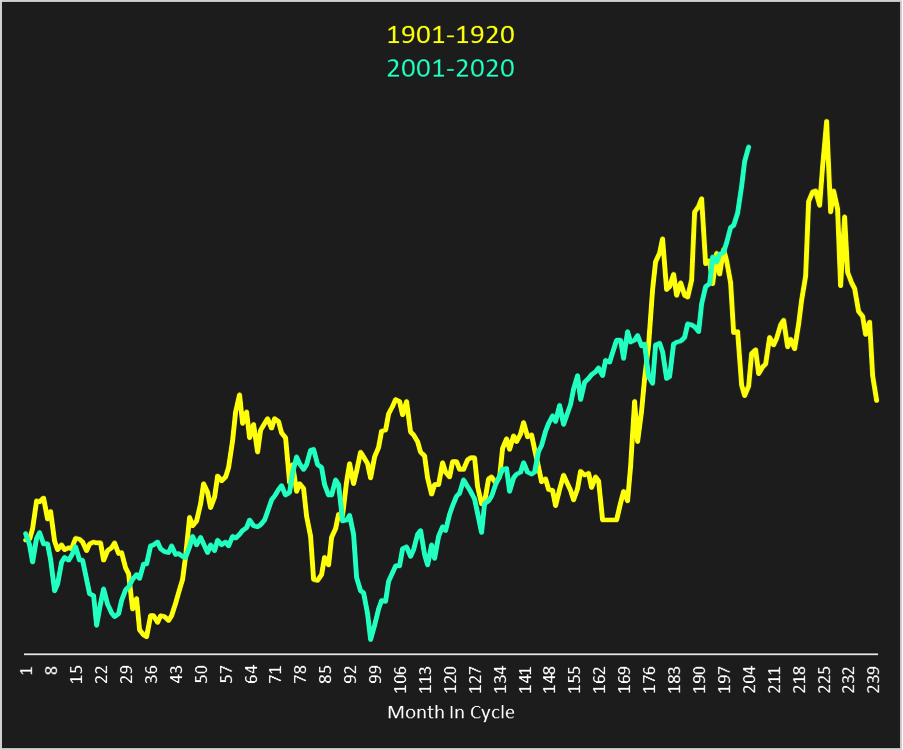
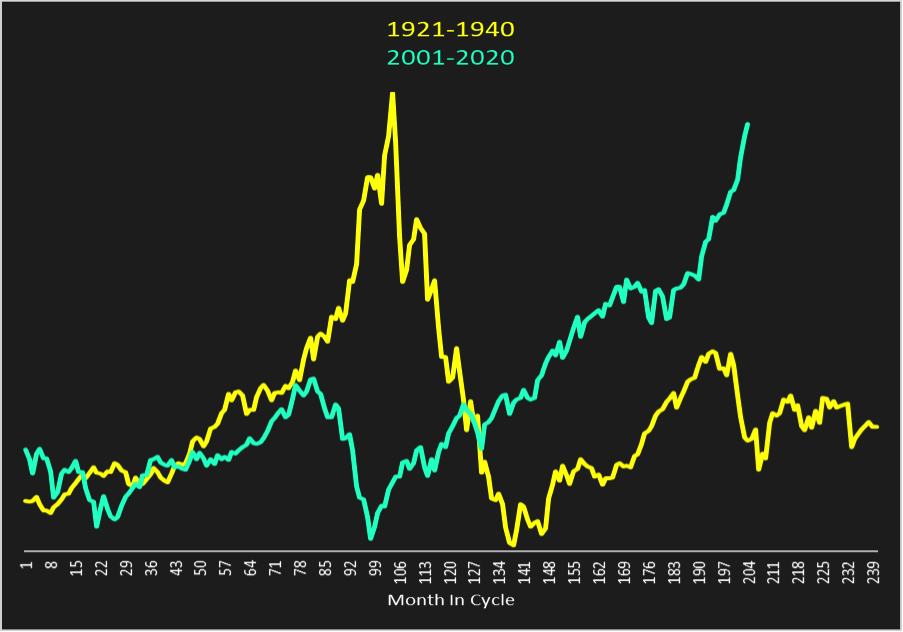
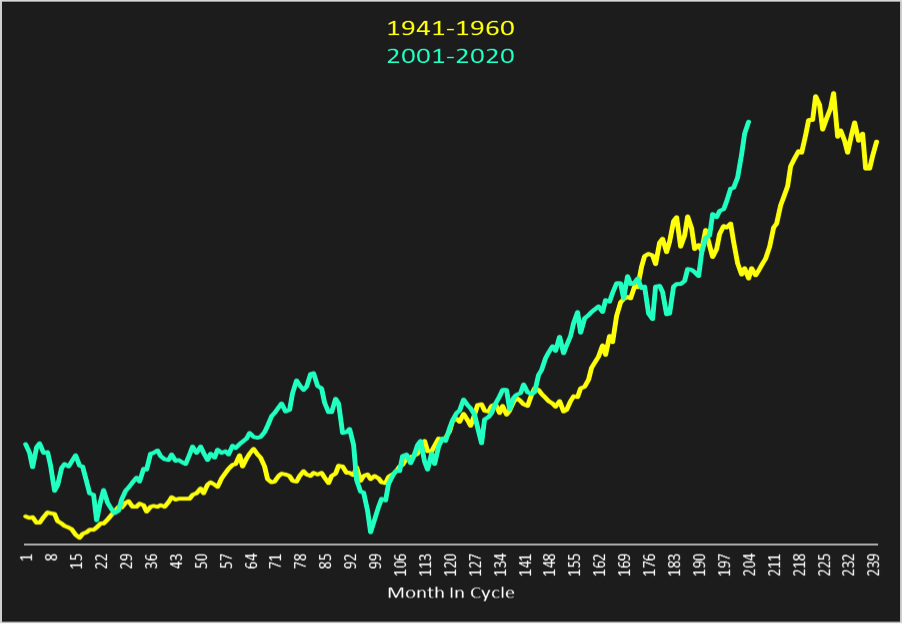
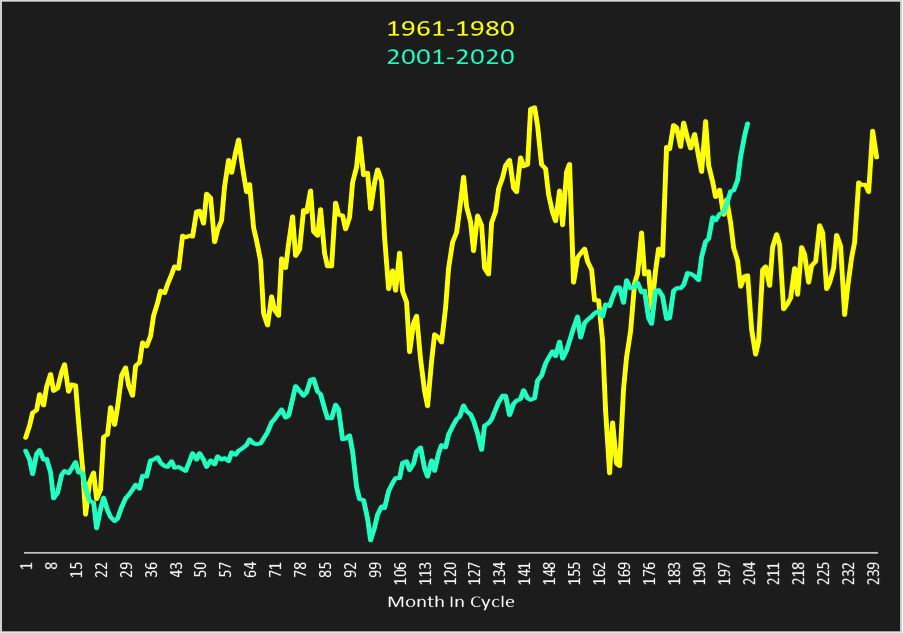
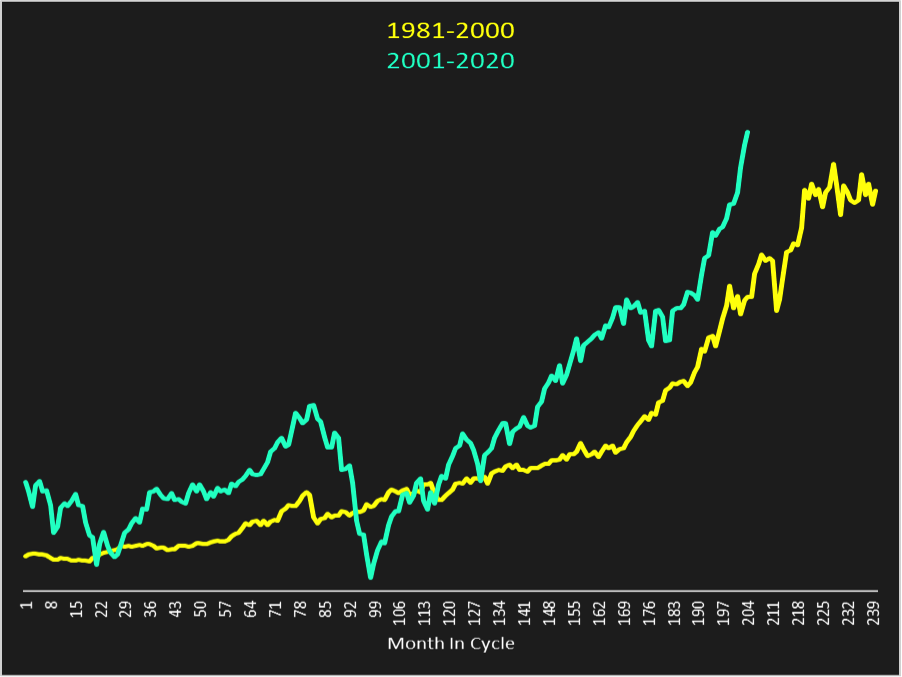
To use the data effectively and prepare a forecast, I compare the progression of the current 20-year cycle (2001-2020) with the previous five 20-year cycles, beginning in 1901. The following five graphs display the comparisons. Price levels are indexed to 1.00 in month 1 of the cycles and, although not labeled on the graphs, that is the scale of the Y-axis.
As seen in the preceding graphs, the current 20-year cycle has some similarities and some differences with the five previous 20-year cycles. Based on that visual analysis alone, the individual correlations are not strong enough to base investment decisions on.
Undeterred by the results from the individual comparisons, I built a composite 20-year cycle. The components of the composite 20-year cycle are the five historical individual 20-year cycles shown in the preceding graphs. The composite 20-year cycle averages those five cycles and, importantly, does not include data from the current 20-year cycle.
continue reading this article on the next page…

