The Dow Jones Industrial Average (DJIA) touched down near the 16,000 level again this month as the correction continues in earnest.
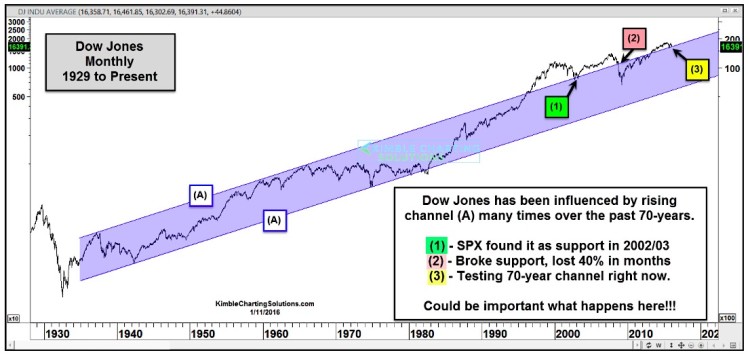
This has investors on edge… and rightfully so. If we look at a longer-term trend chart we can see that big moves have occurred around the upper and lower boundaries of the decades long bull market (see chart below).
The Dow Jones Industrials has made several important highs and harrowing lows along the rising channel (A) over the past several decades. And the last couple of times that the channel line (A) soared into importance was at the 2002/2003 stock market lows and right before the financial crisis and big decline in 2008.
When the Dow Jones Industrial Average hit channel (A) back in 2002/03 it was support… and it held. The S&P 500 Index then proceed to go on a multi-year bull market run higher.
But when the Dow Jones hit channel (A) back in 2008, that support gave way, and the Dow Jones proceeded to decline 40 percent over the coming months.
All in all, the current stock market decline can be classified as a correction thus far. Over the past 7 months, the Dow Jones Industrial Average has pulled back and is once again testing the rising channel (A) – see point (3). Will this level hold as support?
Think about the stats laid out above: The Dow Jones Industrial Average (DJIA) rallied 80% in the next 5-years after support held at (1). On the flip side, the financial crisis went into full effect when the support gave way at (2).
The current support test at (3) friends looks to be an important one in my humble opinion. Thanks for reading.
Twitter: @KimbleCharting
The author does not have a position in the mentioned securities at the time of publication. Any opinions expressed herein are solely those of the author, and do not in any way represent the views or opinions of any other person or entity.


