After topping in January 2018, the stock market has become a bumpy ride.
We endured a correction on most major stock indexes and are now chopping sideways.
Monitoring the markets for clues about what’s next, I stumbled upon a key index and indicator for the economy and stock market.
The Dow Jones Home Construction Index
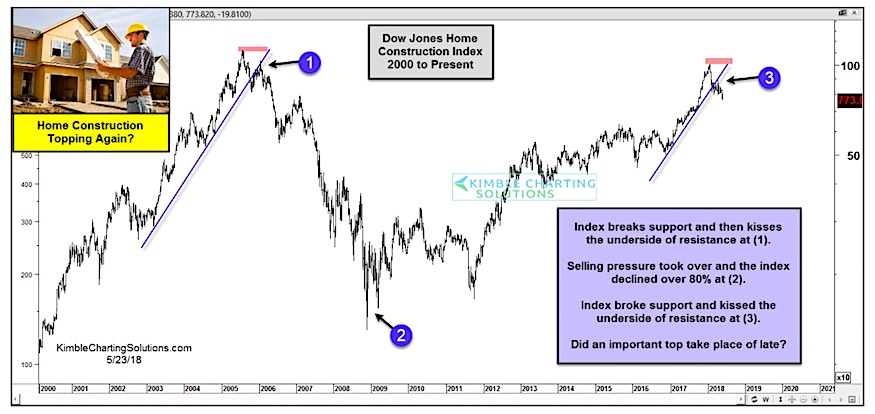
As you can see in the chart below, the Dow Jones Home Construction Index is still correcting. As well, it violated its uptrend line from 2016 (point 3). While this doesn’t mean the bull market is over, it is something to keep an eye on… especially within the housing sector and related stock names.
The last time this pattern occurred was 2005 (two years before the market topped). But it definitely put pressure on the housing market. The bottom on this index didn’t come until 2008/2009 (see points 1 & 2).
Dow Jones Home Construction Index Chart
Twitter: @KimbleCharting
Any opinions expressed herein are solely those of the author, and do not in any way represent the views or opinions of any other person or entity.


