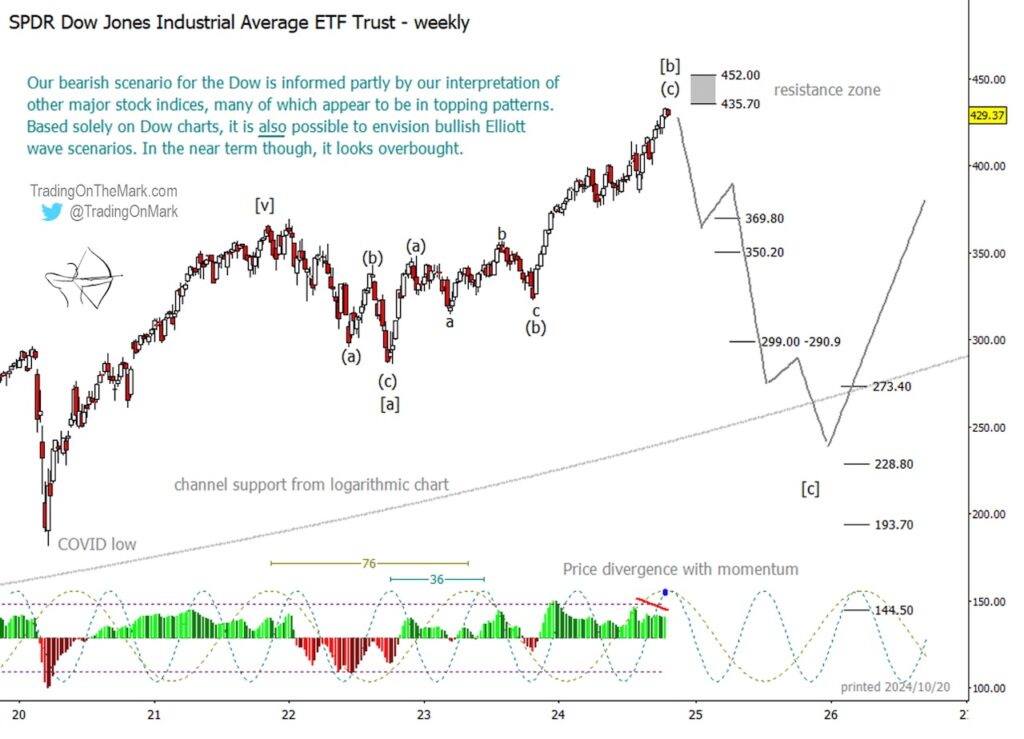
Unlike other stock indices we’ve written about, the Dow Jones Industrial Average doesn’t show signs of weakness on the charts. However, it shows a possibly completed upward pattern that could precede a reversal.
Our overall bearish view of the stock market is informed mainly by signs of weakness in other stock indices, and this article shows how a bearish scenario might translate to the SPDR Dow Jones Industrial Average ETF Trust (NYSEARCA:DIA).
While the S&P 500 appears to be struggling a bit more to overcome each resistance level, and the NASDAQ 100 and Russell 2000 appear to be putting in lower highs, the Dow Jones Industrial Average has maintained a steep rally pushing into new highs for the past month.
In the absence of context, it’s possible to envision a bullish Elliott wave count for the Dow Jones Industrial Average that could take the index much higher later in the decade. (That bullish scenario isn’t shown on our chart here, and we believe it is unlikely to occur.)
On the other hand, the Dow Jones Industrial Average has satisfied the formal wave count requirements for an upward corrective rally, so Elliott wave theory says there is the potential for a major decline to start from nearby.
In our view, a sizable downward impulse is needed in order to present a counterpart to the decline from 2021 to late 2022.
On the weekly chart below, we show how the rise from late 2022 can be counted as corrective, even though it is also possible to assign a long-term bullish wave count to the move. In either case, there is a fairly strong resistance zone for Jones Industrial Average etf (DIA) in range between 435.70 and 452.00, and we think the market will notice the resistance regardless of whether a big-picture bullish or bearish scenario is working.
Looking at other technical factors, we note that the momentum indicator on the weekly chart shows negative divergence, which often precedes either a pullback or a reversal. In addition two of the most dominant cycles for DIA have peaks around now, with cycle periods of 76 weeks and 36 weeks, suggesting that the rally might run out of steam soon. Overall, this market looks overbought on the weekly chart.

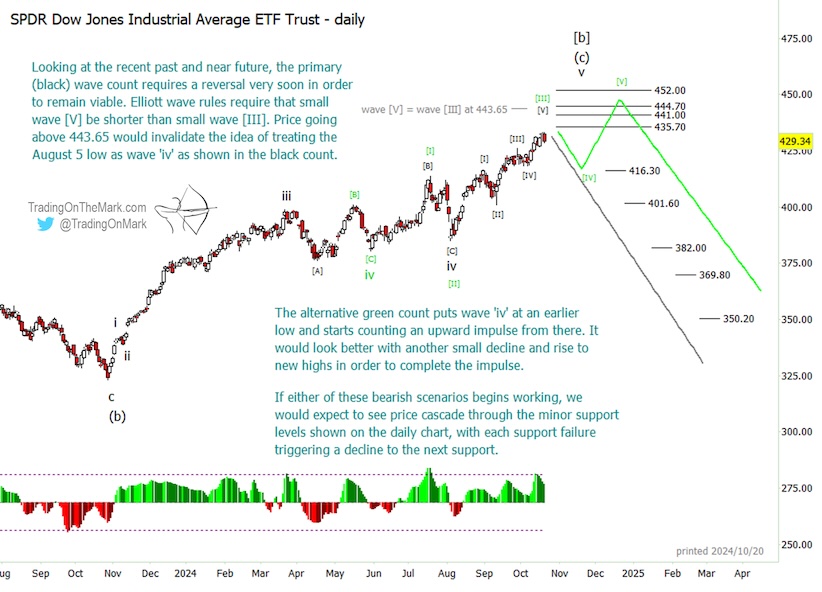
At a finer level of detail, the wave count is a little ambiguous. The interpretation shown with black labels on the daily chart suggests that a high could occur very soon. It also presents an upper limit at 443.65 for the current swing that began on October 7. If price goes above that level, it would invalidate the specific (black) count going forward from April, but it would still allow for other bearish scenarios to unfold.
An alternative wave count indicated with green labels shows how the recent action could call for one more down-up sequence before the pattern is complete. There are yet more ways to count the move too.

Within the resistance zone we mentioned earlier, there are specific fibonacci-based resistance levels at 435.70, 441.00, 444..70 and 452.00.
The first real warning sign for bulls on a DIA chart would be a break and daily close beneath support at 416.30. A break of 401.60 would be an even clearer bearish signal.
Elliott wave analysis identifies the places where the market is more likely to turn, as well as the possible target destination of a move. It also shows where price specifically should not go if the main scenario’s thesis is true. For a trader to make use of these “if this, then that” types of scenarios, it’s helpful to have guidance from people who have already integrated Elliott wave into their trading. Our newsletter follows the major stock indices, currencies, metals, bonds, and related markets on weekly and daily time frames. You can also inquire about our intraday service, which is more customized.
Our newsletter follows the S&P 500 and related markets on weekly and daily time frames. Now that the trading season is in full swing, Trading On The Mark is offering specials subscriber savings. You can also inquire about our intraday service, which is more customized.
Twitter: @TradingOnMark
The authors may have a position in the mentioned securities at the time of publication. Any opinions expressed herein are solely those of the author, and do not in any way represent the views or opinions of any other person or entity.


